

 Tiếng Việt
Top 3 order flow indicators on Tradingview
| Date: 22/02/2026 | 5814 Views | Investment and Trading Academy |
Top 3 order flow indicators on Tradingview to spot big trades, absorption, and valid support/resistance levels
Welcome back to Tradevietstock. Many traders operate without a clear data-driven plan, often guessing at liquidity locations in a market where it appears to be everywhere. Without the right tools, it is difficult to distinguish between high-probability support/resistance levels and “noise” that leads to false breakouts.
To solve this problem and identify a genuine market edge, we will break down the top 3 Order Flow indicators for TradingView. These tools allow you to move beyond guesswork by visualizing where institutional volume is actually being transacted.
i. Footprint Charts: Technical Overview
One of our top 3 order flow indicators on Tradingview is Footprint chart. This is a multidimensional data visualization tool that displays traded volume at specific price levels within a given timeframe. Unlike traditional candlesticks, which only provide Open, High, Low, and Close (OHLC) data, the Footprint chart maps the execution of market orders to provide a granular view of order flow.
1. Why Use Footprint charts
The Footprint chart is utilized to identify the relationship between price action and volume distribution. Its primary functions include:
- Transparency of Execution: It allows traders to see the “Bid-Ask” spread in real-time, showing exactly how many contracts or shares were bought at the ask versus sold at the bid.
- Identification of Order Flow Imbalances: It highlights price levels where aggressive market participants have overwhelmed passive limit orders, indicating directional conviction.
- Market Microstructure Analysis: It reveals the Point of Control (POC)—the specific price where the most significant volume occurred—providing a more precise level of support or resistance than a standard candle body.
- Detection of Absorption: It assists in spotting “exhaustion” or “absorption,” where high volume occurs at a price level without further movement, suggesting a trend may be stalling.

2. How to use Footprint charts
| Step | Action | Objective |
| 1. Analyze Imbalances | Compare the bid on the left to the ask on the right (one tick higher). | Identify aggressive buying or selling pressure (usually defined by a 3:1 or 4:1 ratio). |
| 2. Locate the POC | Identify the price level within the candle containing the highest volume. | Use this level as a “value area” for entries or to gauge if the market is accepting or rejecting a price. |
| 3. Observe Delta | Review the net difference between buying and selling volume for the entire bar. | Determine if the overall momentum of the candle is truly bullish or bearish based on actual participation. |
| 4. Identify Trapped Volume | Look for high volume at the “wicks” or extremes of the price range. | Spot where traders are positioned on the wrong side of a move, which often leads to a rapid price reversal as they liquidate. |

ii. TPO: Support, Resistance, and Bias
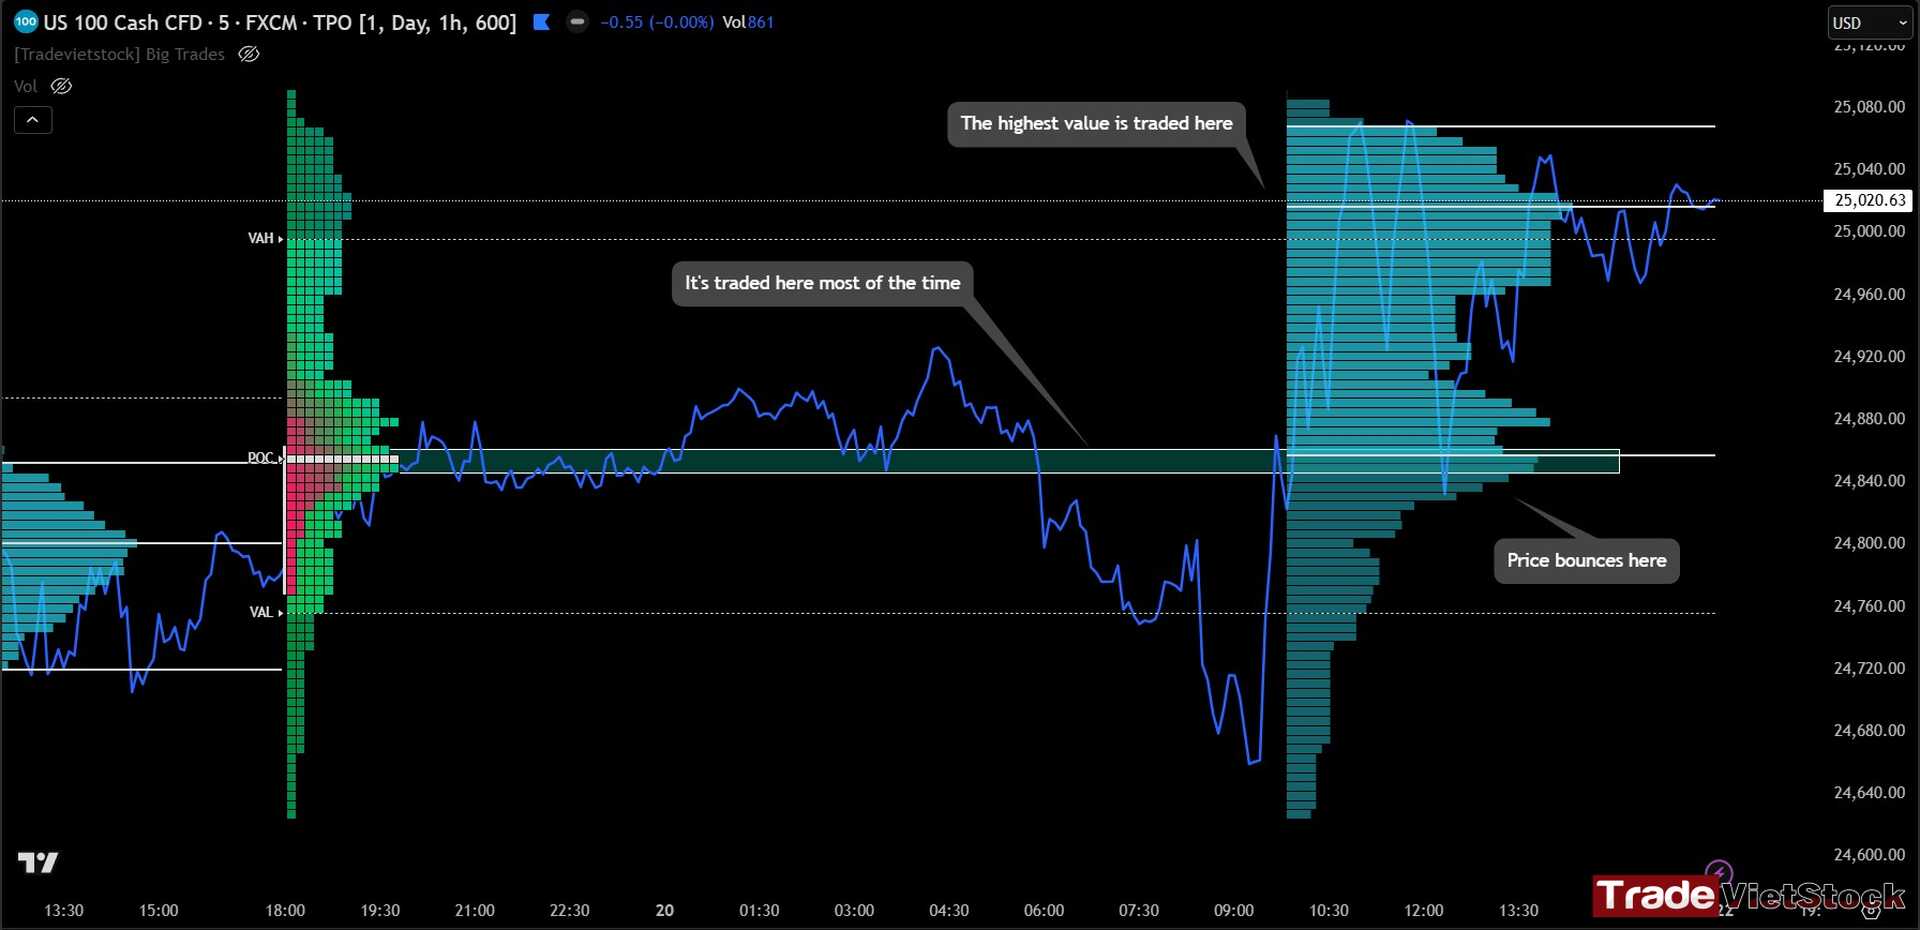
The next one in our top 3 order flow indicators on Tradingview is TPO chart. This identifies “Value” based on time. By observing where the market finds acceptance, traders can project key levels and determine the likely direction of the next session.
1. Identifying Key Levels (Support & Resistance)
In TPO theory, support and resistance are not just lines on a chart; they are zones of high and low acceptance.
- TPO POC (Point of Control): The price where the market spent the most time. In future sessions, this level acts as a “magnet.” If the price approaches it from above, it often acts as support; from below, it acts as resistance.
- Value Area High/Low (VAH/VAL): These represent the boundaries of the 70% time-at-price area. A breakout from these levels indicates a change in sentiment, while a rejection at these levels confirms the range.
- High Volume Nodes (HVN) vs. Low Volume Nodes (LVN): While TPO tracks time, these often correlate. High-time areas (HVNs) are where the market is comfortable. Low-time areas (LVNs or Single Prints) are where the market moved too fast, creating “gaps” that often act as strong support/resistance when revisited.
2. Determining Directional Bias
Your observation about the “higher price” is referred to as Value Area Migration. This is the primary tool for determining the bias for the following day.
| Market Condition | Observation | Resulting Bias |
| Overlapping Value | Today’s Value Area is largely the same as yesterday’s. | Neutral/Range: The market is in balance. Look for rotations between VAH and VAL. |
| Value Moving Higher | Today’s Value Area (and POC) is higher than yesterday’s. | Bullish: Buyers are accepting higher prices. Expect the uptrend to continue or look for buy entries on dips to the previous POC. |
| Value Moving Lower | Today’s Value Area (and POC) is lower than yesterday’s. | Bearish: Sellers are forcing acceptance at lower levels. Expect the downtrend to continue. |
| Gapping Outside Value | Price opens completely outside of yesterday’s Value Area. | High Conviction: This indicates a major shift in sentiment. Trading in the direction of the gap is usually the high-probability play. |
iii. Big Trades Indicator: Institutional Order Flow Analysis
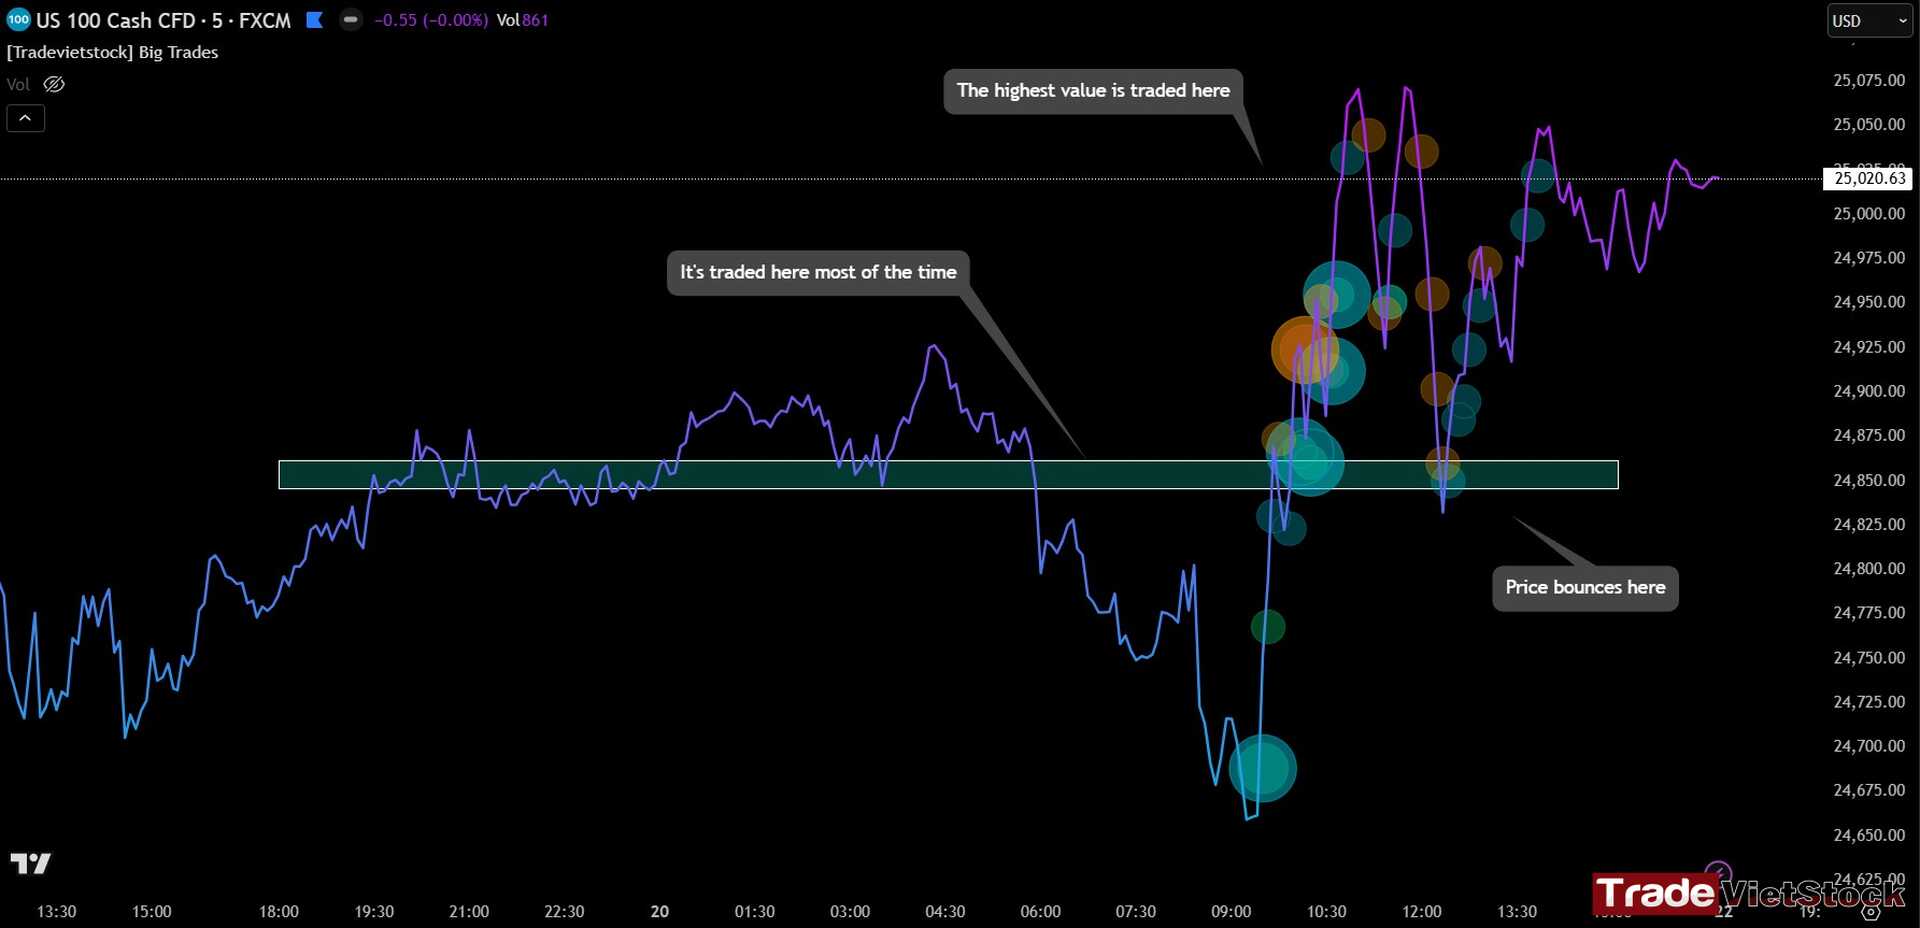
This one stands out among all top 3 order flow indicators on Tradingview, Big Trades Indicator. It is a data-visualization tool designed to identify large-scale institutional executions. By filtering out retail “noise,” it highlights specific price levels where significant volume or aggressive delta has entered the market, often referred to as “Smart Money” footprints.
1. Why use Big Trades Indicator?
Standard lagging indicators (like RSI or MACD) calculate based on past price movements. The Big Trades indicator uses real-time order flow data to provide the following advantages:
- Institutional Transparency: It identifies the exact moments when large-scale market participants execute trades, allowing retail traders to align with institutional momentum.
- Liquidity Identification: It highlights “liquidity pools” where massive orders have been filled. These areas frequently act as strong support or resistance in future sessions.
- Precision Filtering: The indicator uses dynamic scaling (Tier 1 to Tier 4) to categorize trade importance, ensuring traders focus only on “Market Shifting” volume.
- Reduced Complexity: It translates dense “Tape Reading” or “Footprint” data into clean visual cues (circles) directly on standard TradingView charts.
2. How to use Big Trades Indicator?
As the best one among top 3 order flow indicators on Tradingview, effective use of the Big Trades Indicator requires differentiating between total volume intensity and directional conviction (Delta).
| Feature | Technical Function | Trading Application |
| Fixed Volume (Lime/Red) | Measures total “Work” done at a price level, regardless of direction. | Use to identify high-interest zones where the market is fighting for control. |
| Fixed Delta (Aqua/Orange) | Measures net aggressive buying vs. selling (conviction). | Look for Aqua circles at support to confirm an aggressive “Long” entry. |
| Tiered Scaling (1–4) | Categorizes trades by size, with Tier 4 being the largest. | Treat Tier 3 and 4 levels as “Brick Walls”—expect significant price reactions. |
| Asset Presets | Calibrated thresholds for NQ, Gold (GC), and GER40. | Use presets to ensure the “Big Trade” signals are relative to that asset’s specific liquidity. |

3. Tactical Implementation
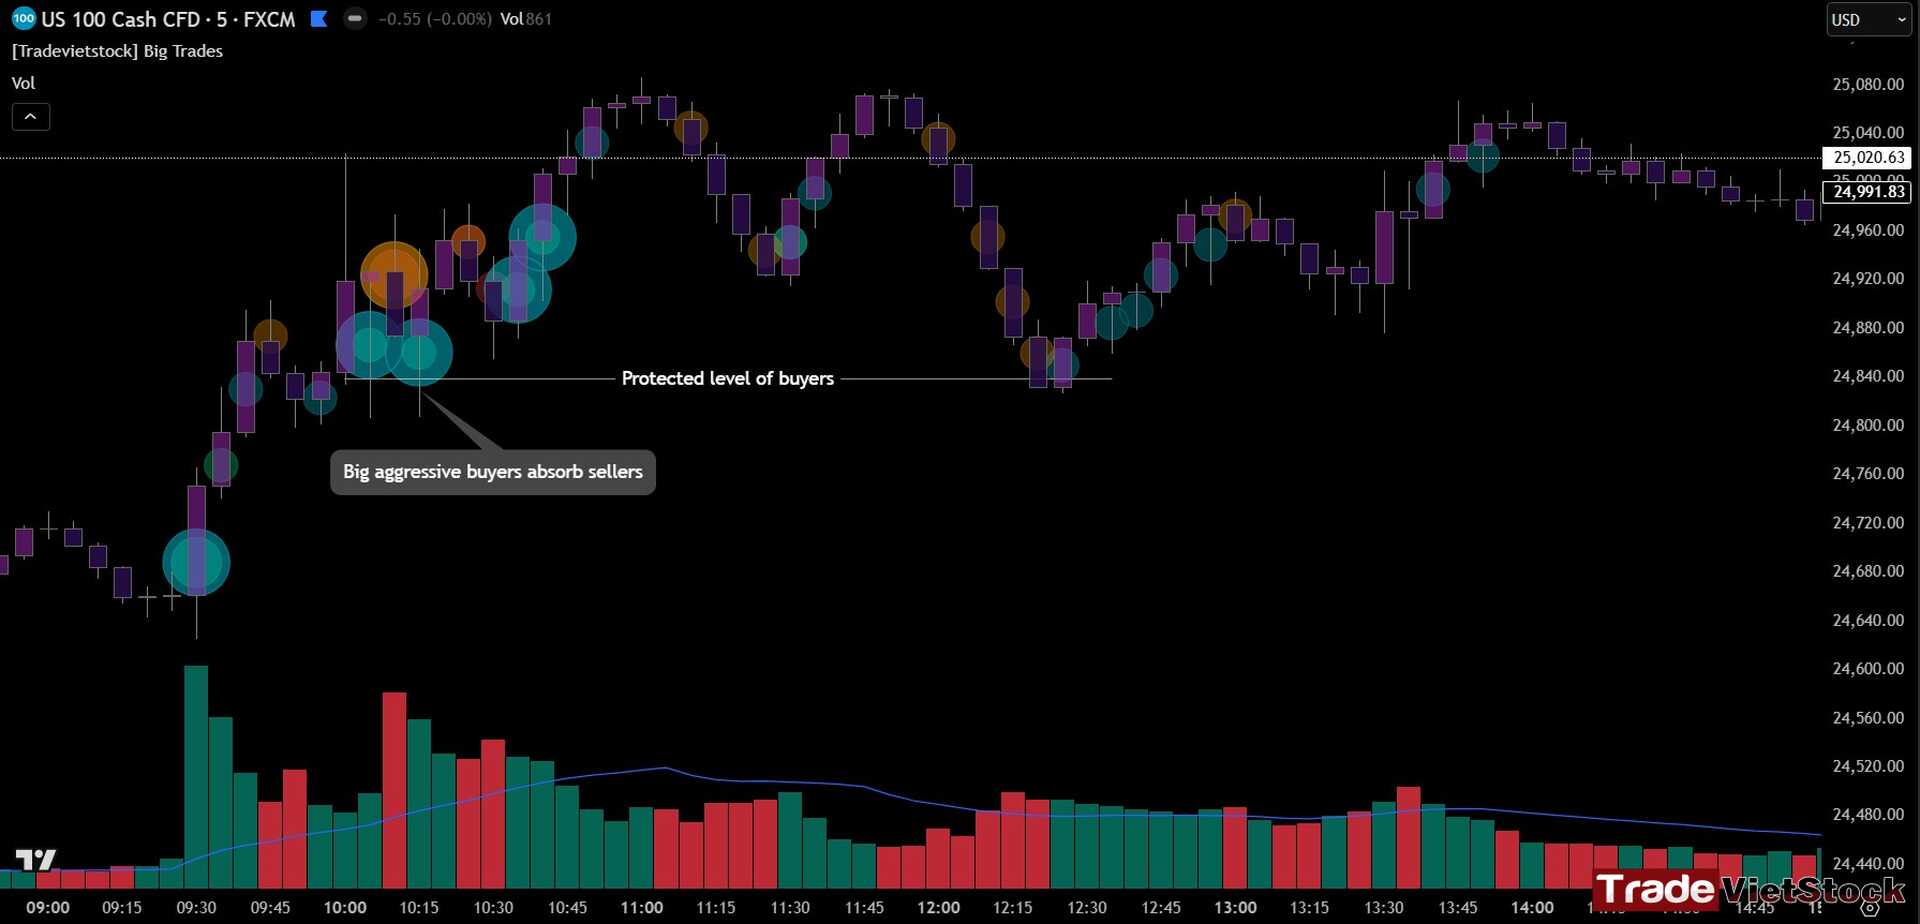
Spotting Aggressive Absorption: If price enters a resistance zone and Large Red/Orange circles (Sellers) appear, but the price fails to drop, it indicates buyers are absorbing the selling pressure—a potential bullish breakout signal.
Trading the “Magnet” Effect: Tier 4 trades often create a “Point of Control” for the day. If the price moves away from a Tier 4 circle, it will often return to retest that level before continuing its trend.
Trend Confirmation: In an uptrend, look for clusters of Aqua circles (Aggressive Buying) to confirm that institutions are supporting the move.
4. Specifications & Optimization
| Asset Class | Recommended Timeframe | Primary Logic |
| NAS100 (NQ) | 1m – 5m | Scalping / Day Trading |
| XAUUSD (Gold) | 5m | Trend Following |
| GER40 (DAX) | 5m | Scalping / Day Trading |
Color Key:
- 🟢 Lime: Large Buy Volume (Total Intensity)
- 🔵 Aqua: Bullish Delta (Aggressive Market Buying)
- 🔴 Red: Large Sell Volume (Total Intensity)
- 🟠 Orange: Bearish Delta (Aggressive Market Selling)
iv. Final words
To ensure you have the necessary infrastructure to run these professional order flow tools, you will first need an active TradingView account. If you do not yet have a plan or an account, you can Discover your plan on Tradingview to get started with the world’s most powerful browser-based charting software.
Once your account is set up, you can gain immediate access to institutional-grade data by adding our proprietary tool to your arsenal. Purchase Big Trades Indicator – 1 Year Membership to begin tracking smart money footprints and filtering market noise. By combining a reliable charting platform with high-conviction order flow signals, you transition from reactive trading to proactive market participation.
Ready to trade with the best automated trading strategy? Have you registered for a trading account yet?
[Link to register for a free Exness trading account]
[Link to register for a free XTB trading account]
You can also experience world-class services and trusted reputations from some of the top 5 crypto exchanges:
- Binance — The largest crypto exchange on Earth
- Bybit — A well-established name known for its long-standing reputation and diverse financial instruments
- Bitget trading account — User-friendly interface combined with a strong reputation
- MEXC trading account — The lowest trading fees with one of the most beginner-friendly interfaces
- OKX — A major name known for secure asset storage and powerful DEX tools



I got cured of my herpes disease on June14th (2026) after just two weeks of using Doc. Kham herbal medicine. You’re just too real, Your herbal medicine is so effective in eradicating the Herpes simplex virus. You’re a great doctor, A very powerful African Herbalist Doctor you’re. God bless you for getting me cured and helping others as well, I’m so excited. I have just been cured from HSV….. Thank you so much my good doctor, You actually made me believe that herpes truly has a complete cure and the only cure is Herbal Remedy of which I used and my whole story changed. You’re indeed a blessing to mankind, and your herbal medicine works so effectively. I’m so happy Everything is natural in your making and you never look fake because you always do your things with proofs and facts. You’re indeed legit and I’m so happy to be cured of my long term herpes Virus by your herbal medicine. Contact Doc Kham on his Email dr.khamcaregiver@ gmail. com and His Website is herbalistdrkhamcaregiver. simdif. com/