

 Tiếng Việt
Deep volume profile indicator
| Date: 20/03/2026 | 2443 Views | Investment and Trading Academy |
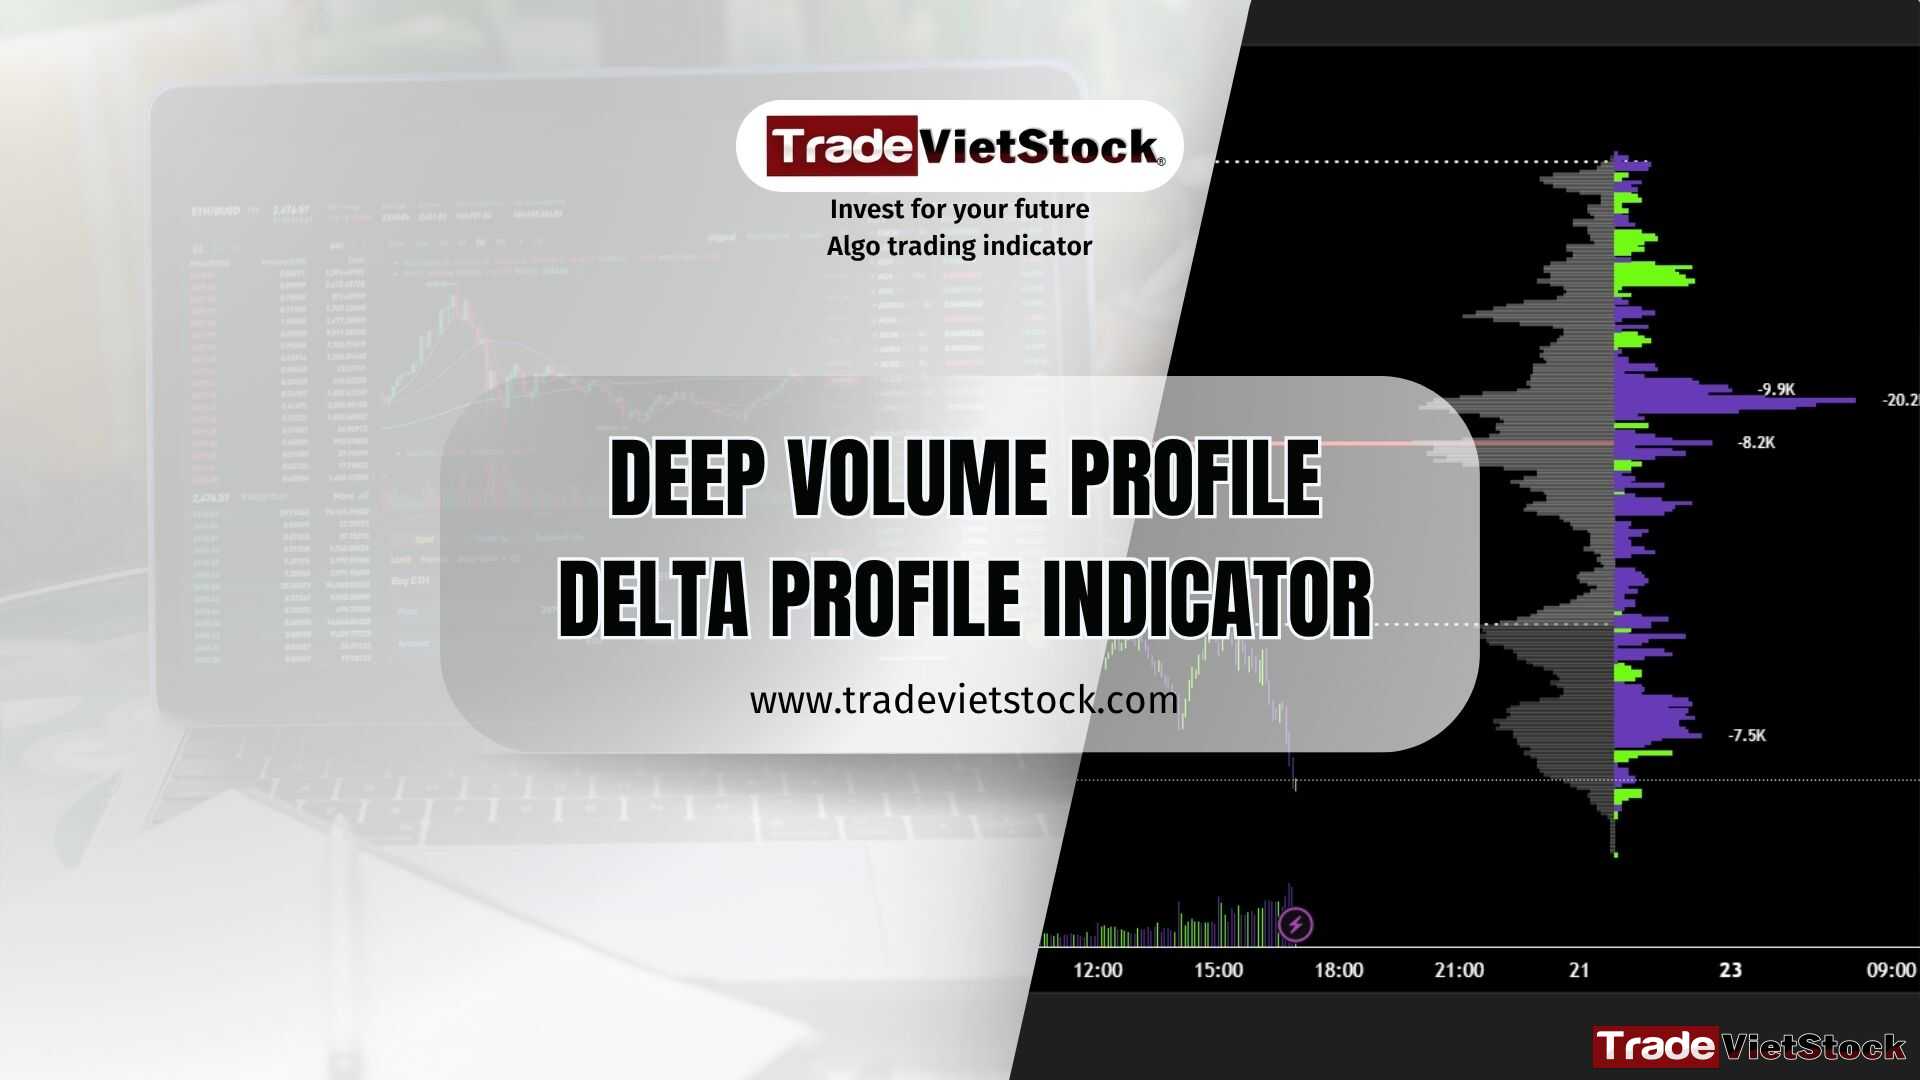
Deep Volume Profile Indicator: Trading with Delta Profile to Spot Market Sentiment
Welcome back to Tradevietstock! Today, we are diving into a tool built specifically for serious practitioners of Order Flow and Auction Market Theory (AMT).
Most traders rely on standard Volume Profiles and essentially “guess” who is in control. The Deep Volume Profile indicator removes that guesswork. By calculating Real-Time Delta Sentiment at every price level, it reveals exactly where “Big Money” is placing resting limit orders and where aggressive participants are getting trapped.
i. Why Use the Deep Volume Profile Indicator?
A normal Volume Profile is “blind.” It shows you where the car went, but it doesn’t show you who was driving.
1. Standard Profile:
Shows total volume (Grey nodes). You see a “High Volume Node” but have no idea if it was 90% selling or 90% buying. Who actually dominates that level?
2. Deep Volume Profile:
The deep delta profile calculates the Net Delta (Green/Purple nodes) at every price bin. This allows you to stop trading blindly and start reading the actual “intent” of the market in real-time.
Identify Dominance: Identify exactly who controls a level—whether it’s aggressive buyers, sellers, or massive resting limit orders. As shown in the image below, you can easily spot the largest bearish node. You won’t mistake which block will hold because the Deep Delta Profile reveals exactly where the real orders are sitting.
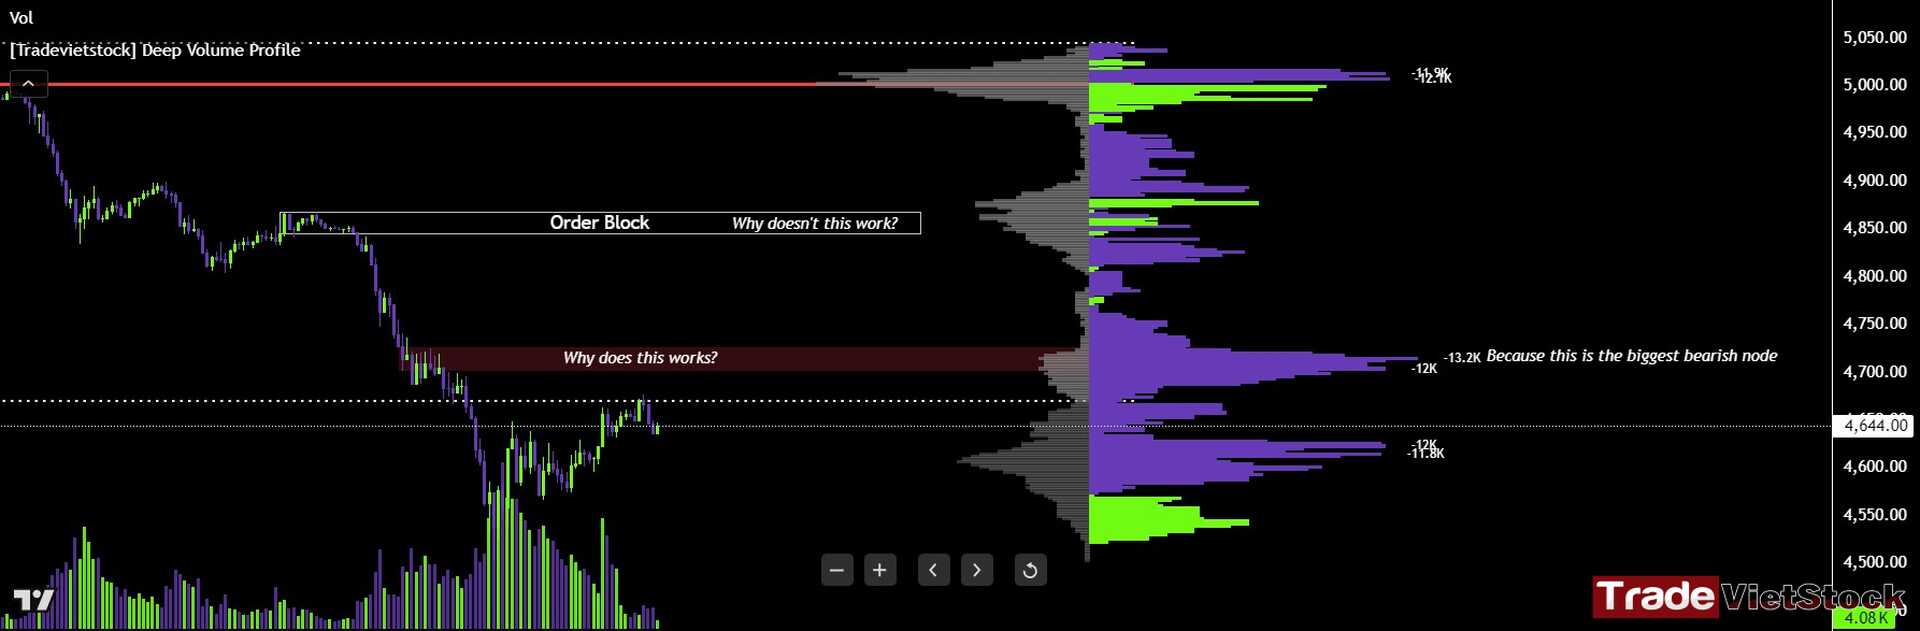
Validate Zones: Instead of drawing a “guesswork box” based on a random candlestick, use Delta to prove if an Order Block is backed by actual capital. As shown in the image, the largest bearish node identifies the true bearish order block you should be trading. It is far more reliable than a generic box drawn randomly based on candlesticks alone.
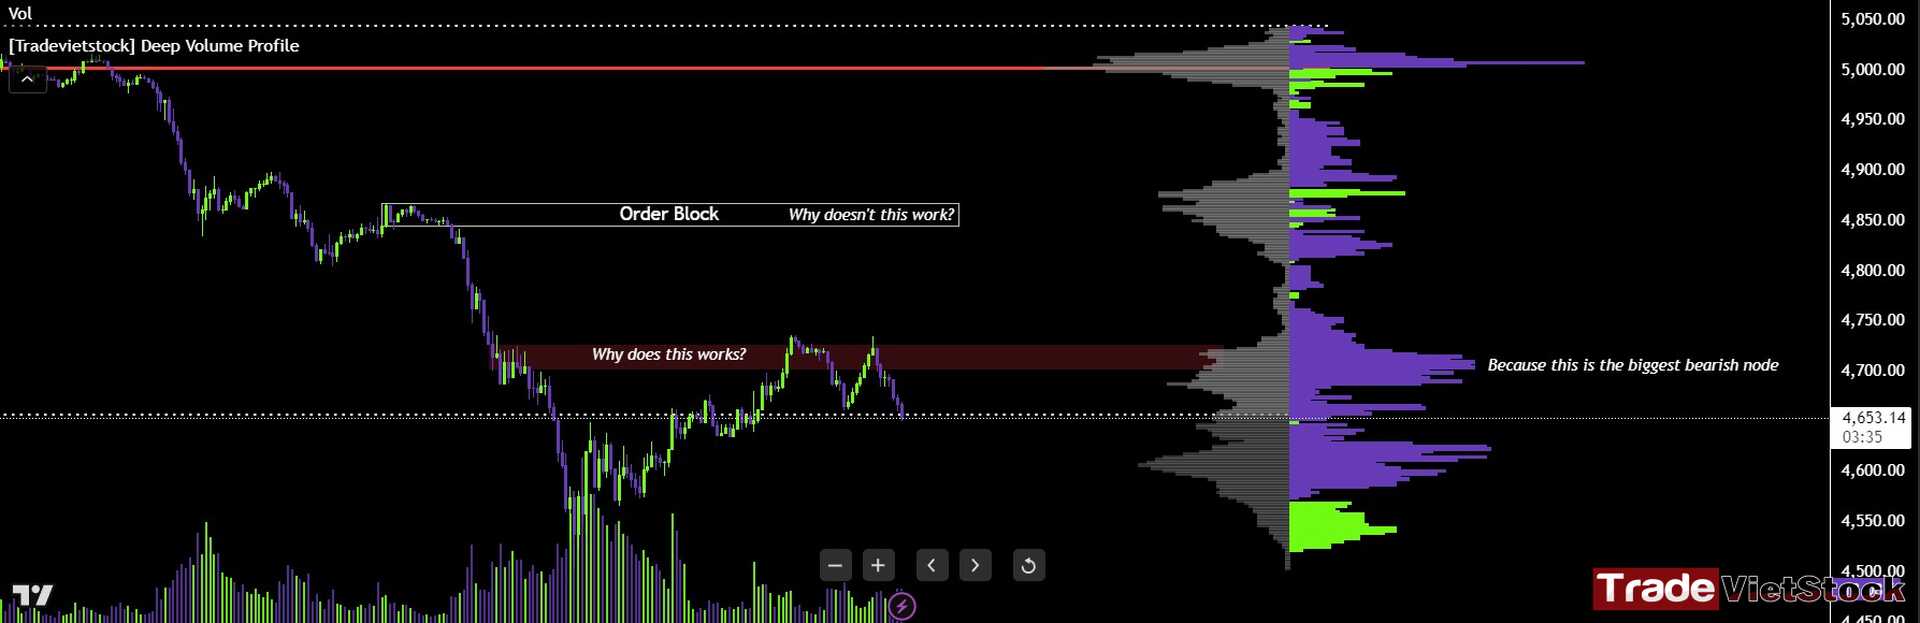
ii. Decoding Deep Delta Profile: Liquidity & Absorption
The Delta Profile nodes (the colored bars extending further right) tell the story of Resting Liquidity. In our strategy, large clusters represent a “Wall” built by professional traders.
1. The Seller’s Wall (Bearish Clusters):
Massive Purple Delta nodes indicate aggressive sellers met a “brick wall” of resting limit orders. If price returns to this zone from below, expect a strong rejection as dominant sellers defend their territory.
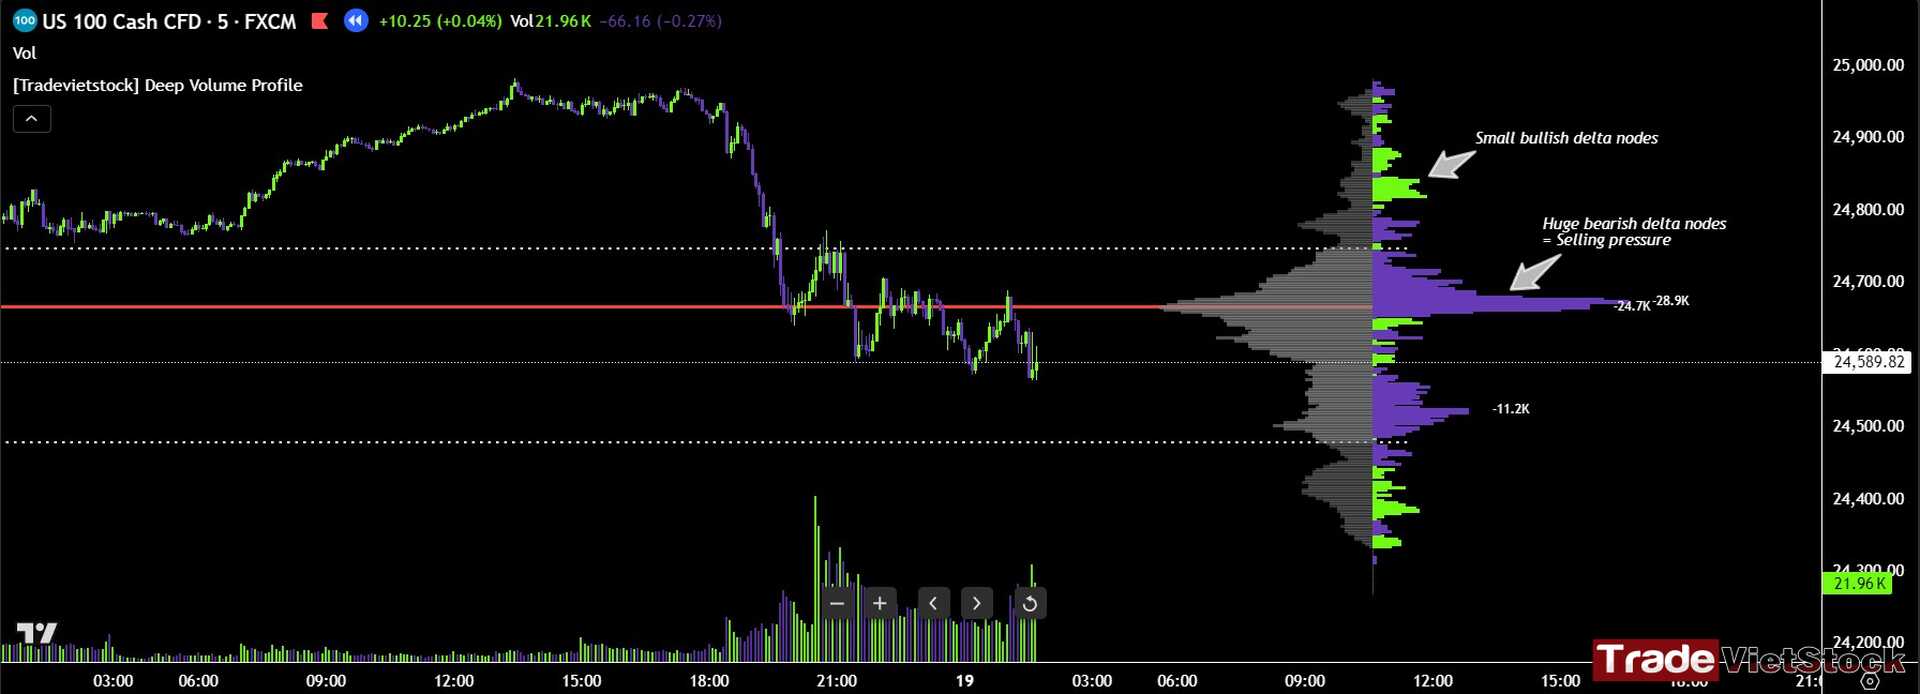
2. The Buyer’s Floor (Bullish Clusters):
A cluster of Green Delta at a low level signals that aggressive selling was absorbed by “Passive Buyers.” This creates a springboard effect for a sharp, aggressive bounce.
Pro Tip: Don’t Trade Mechanically. Auction Market Theory isn’t static. You must apply SBR/RBS (Support Becomes Resistance) logic. For example, if a massive Bullish Delta node is broken and price retests it from below, it often flips into a Bearish Wall.
Why? Because those buyers are trapped or being absorbed; their stop-loss orders (which are sell orders) fuel the move down. True Order Flow means adapting to how support and resistance swap roles as liquidity is consumed.
iii. Identifying High-Reaction Levels
Expect the most significant price volatility and “rejections” at these three structural points:
1. High Volume Nodes (HVN):
These act as price magnets where the market often “sticks” due to high liquidity.
2. Low Volume Nodes (LVN):
These are “liquidity gaps.” Price typically “zips” through these areas quickly because there is no historical interest to slow the auction down.
3. Value Area Edges (VAH/VAL):
These represent the boundaries of “fair value.” Hits to these edges often lead to mean-reversion moves back to the POC.
By using the Deep Delta Profile, you can spot potential breakouts or rejections by observing if the Net Delta is supporting the move. This is your ultimate layer of confirmation.
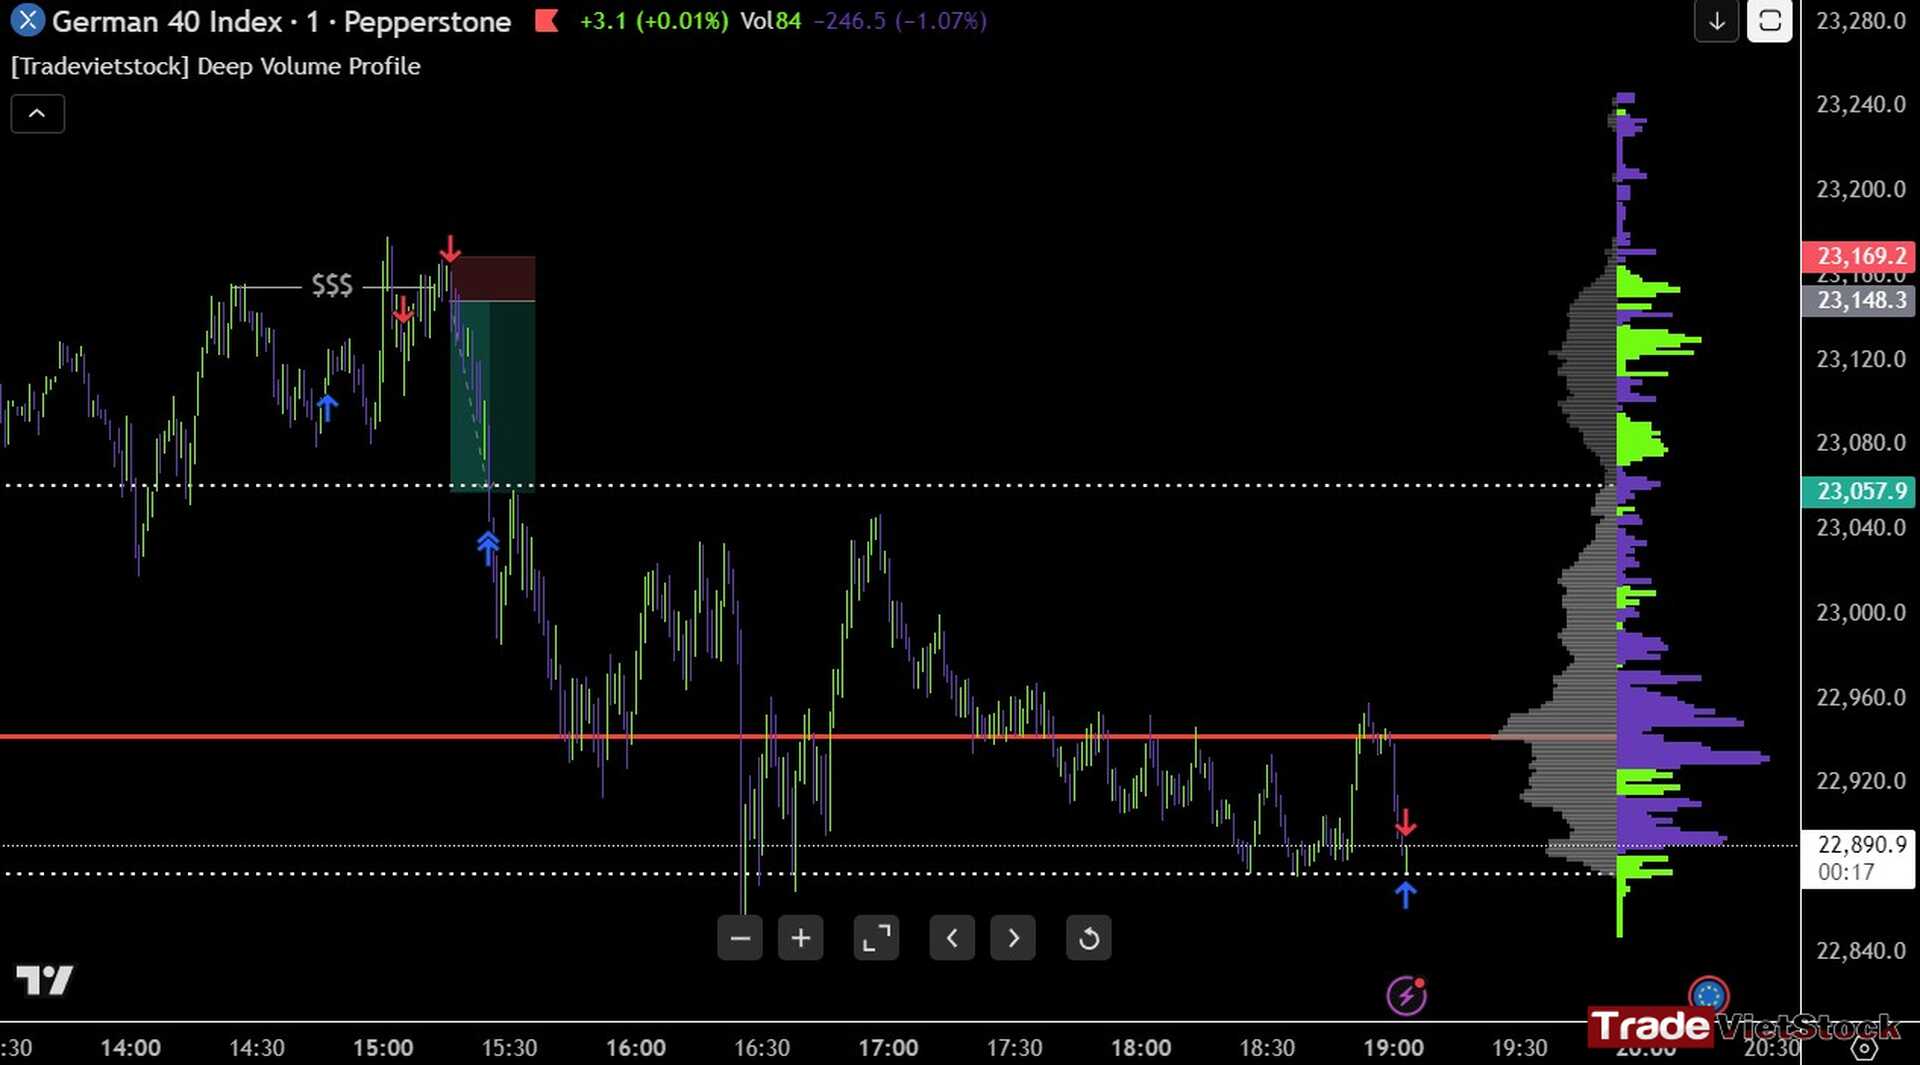
iv. Strategic Execution: Validation Over Guesswork
If you are an ICT trader, this indicator is the ultimate confirmation tool for your PD Arrays.
Stop “Rolling the Dice” on Order Blocks Standard trading involves blindly marking Order Blocks and FVGs, which appear everywhere on a chart. If you trade them all, your accuracy will be no better than a coin flip.
Instead of guessing, use the Deep Volume Profile to detect exactly where an Order Block should be. The Delta Profile validates the zone by showing you if the “Big Fish” are actually stepping in.
1. Real-Time Accumulation:
Since the script calculates data in real-time, you can watch Delta build up. If Bullish Delta grows while price stays flat, it’s a sign that sellers are being absorbed and buyers are building a foundation to push higher.
2. Order Block Validation:
Don’t just trade a candle pattern. Wait for price to enter a zone and look for Delta Clusters to form. This is objective proof of institutional support.
3. The Trap (Short Squeeze):
If you see a “Top 10 Outlier” Bearish Delta node, but price breaks and closes above it, those sellers are trapped. Their buy-side stop losses will fuel an explosive rally.
v. Summary: Stop Guessing, Start Reading
The market is a continuous auction. While others are gambling on who dominates the market, the Deep Volume Profile Indicator allows you to see the real-time shift in power.
Green Nodes = Aggressive Buyers / Support Walls.
Purple Nodes = Aggressive Sellers / Resistance Walls.
This tool is essential for everyone—from Order Flow and AMT experts to ICT scalpers and swing traders.
Ready to level up? Download this algo trading indicator, apply it to your charts, and start seeing the market for what it truly is: a battle of liquidity.
[Link to register for a free Exness trading account]
[Link to register for a free XTB trading account]
You can also experience world-class services and trusted reputations from some of the top 5 crypto exchanges:
- Binance — The largest crypto exchange on Earth
- Bybit — A well-established name known for its long-standing reputation and diverse financial instruments
- Bitget trading account — User-friendly interface combined with a strong reputation
- MEXC trading account — The lowest trading fees with one of the most beginner-friendly interfaces
- OKX — A major name known for secure asset storage and powerful DEX tools



I got cured of my herpes disease on June14th (2026) after just two weeks of using Doc. Kham herbal medicine. You’re just too real, Your herbal medicine is so effective in eradicating the Herpes simplex virus. You’re a great doctor, A very powerful African Herbalist Doctor you’re. God bless you for getting me cured and helping others as well, I’m so excited. I have just been cured from HSV….. Thank you so much my good doctor, You actually made me believe that herpes truly has a complete cure and the only cure is Herbal Remedy of which I used and my whole story changed. You’re indeed a blessing to mankind, and your herbal medicine works so effectively. I’m so happy Everything is natural in your making and you never look fake because you always do your things with proofs and facts. You’re indeed legit and I’m so happy to be cured of my long term herpes Virus by your herbal medicine. Contact Doc Kham on his Email dr.khamcaregiver @gmail. com and His Website is herbalistdrkhamcaregiver.simdif . com