Cycle Detection Indicator for Trading – Market Cycle Detector_Quantum Flux
Hello folks, it’s Tradevietstockagain! Today, I will introduce you to Quantum Flux Indicator, the best cycle detection tndicator for trading, which can help you find your best entry/exit effectively for mid-term investments.
i. Overview
1. What is Market Cycle Detector_Quantum Flux?
The Quantum Flux Indicator, Cycle Detection Indicator for Trading, is developed specifically to analyze and detect market cycles across a variety of asset classes. Whether you trade stocks, crypto, forex, or commodities, this indicator provides a consistent framework to track trends and time your positions.
You can apply the same cycle-based strategy across all these markets using QFI.
Depending on the platform you’re using, here’s how you can start using Quantum Flux:
TradingView Users:
Once your invite is approved, the indicator will be added to your TradingView account. You can access it directly through the Indicators tab.
MT5 / Amibroker Users:
After your payment is completed, we will send you the QFI script. You can then import it manually into your MT5 or Amibroker trading platform.
ii. Setting Up the Indicator
1. Choose Your Setup
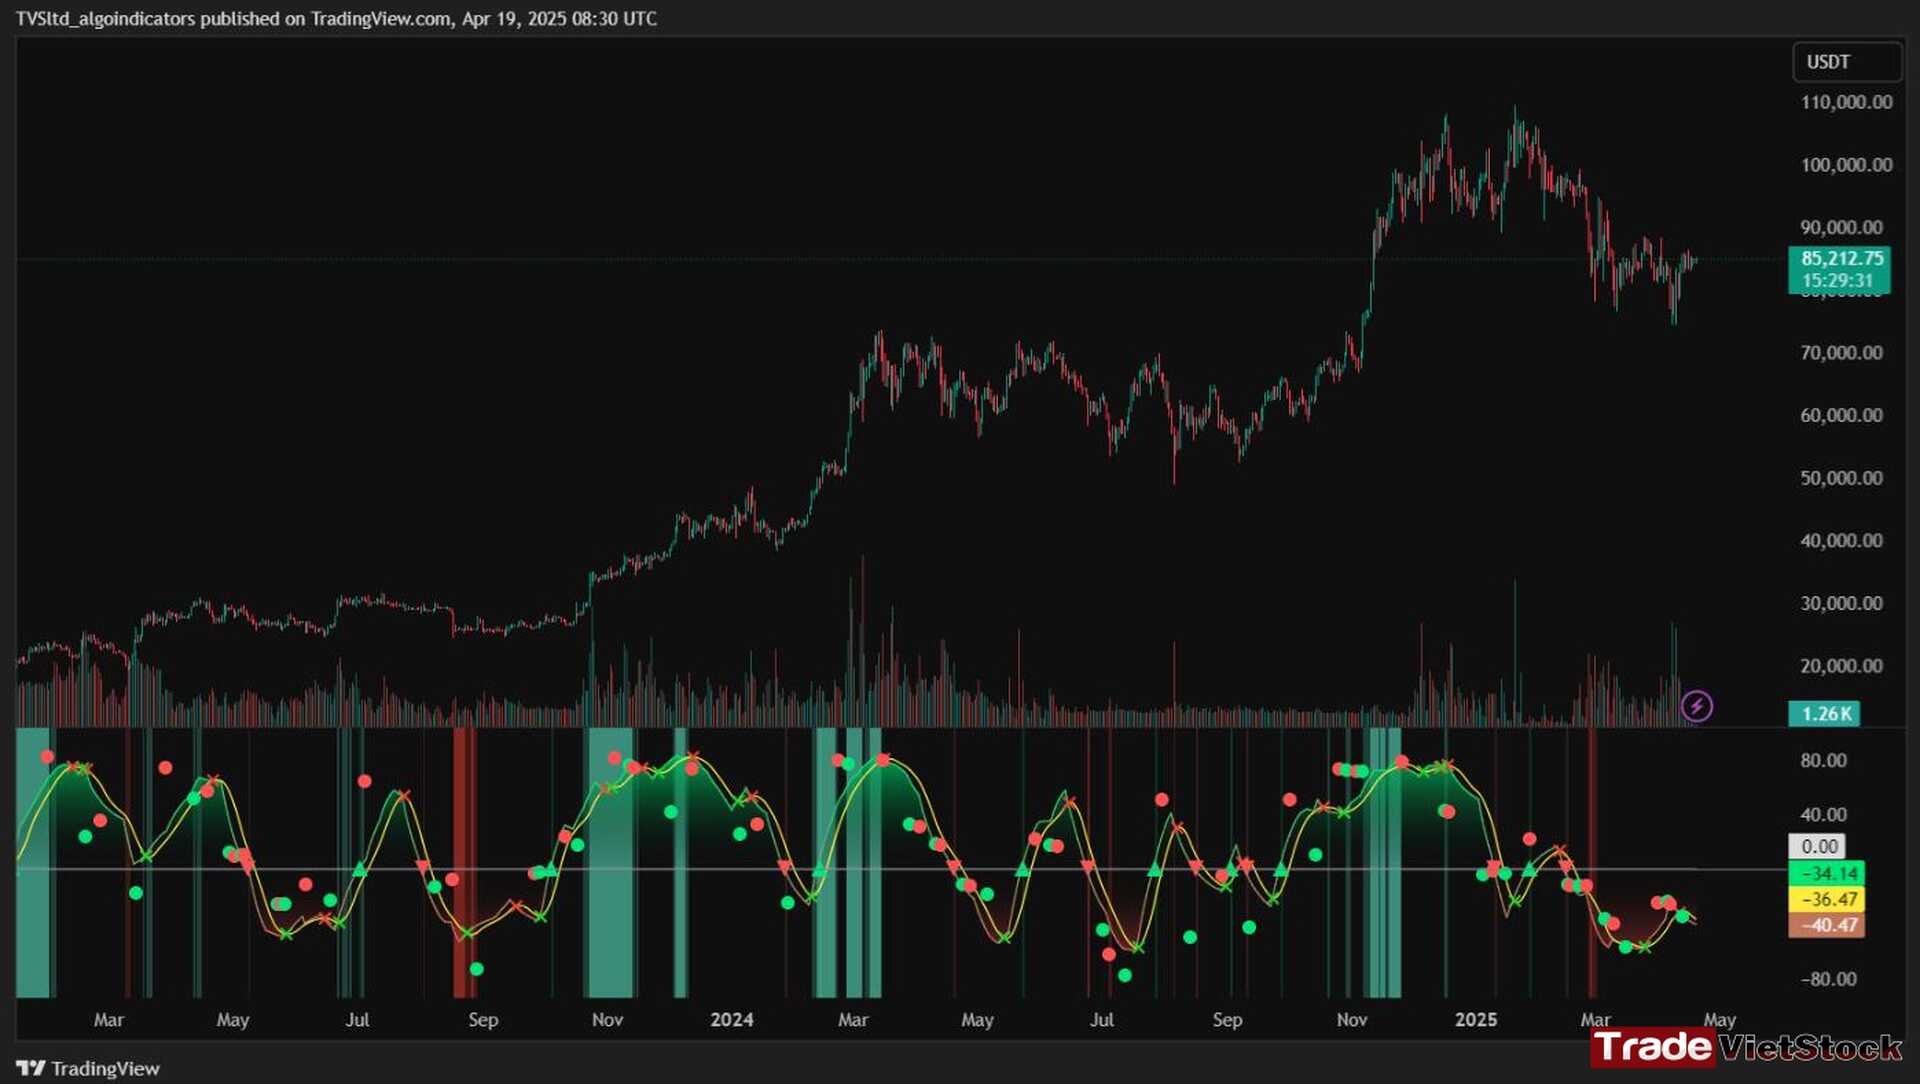
There are two ways to configure the Quantum Flux – the best cycle detection indicator for trading markets:
Default Setup (Recommended)
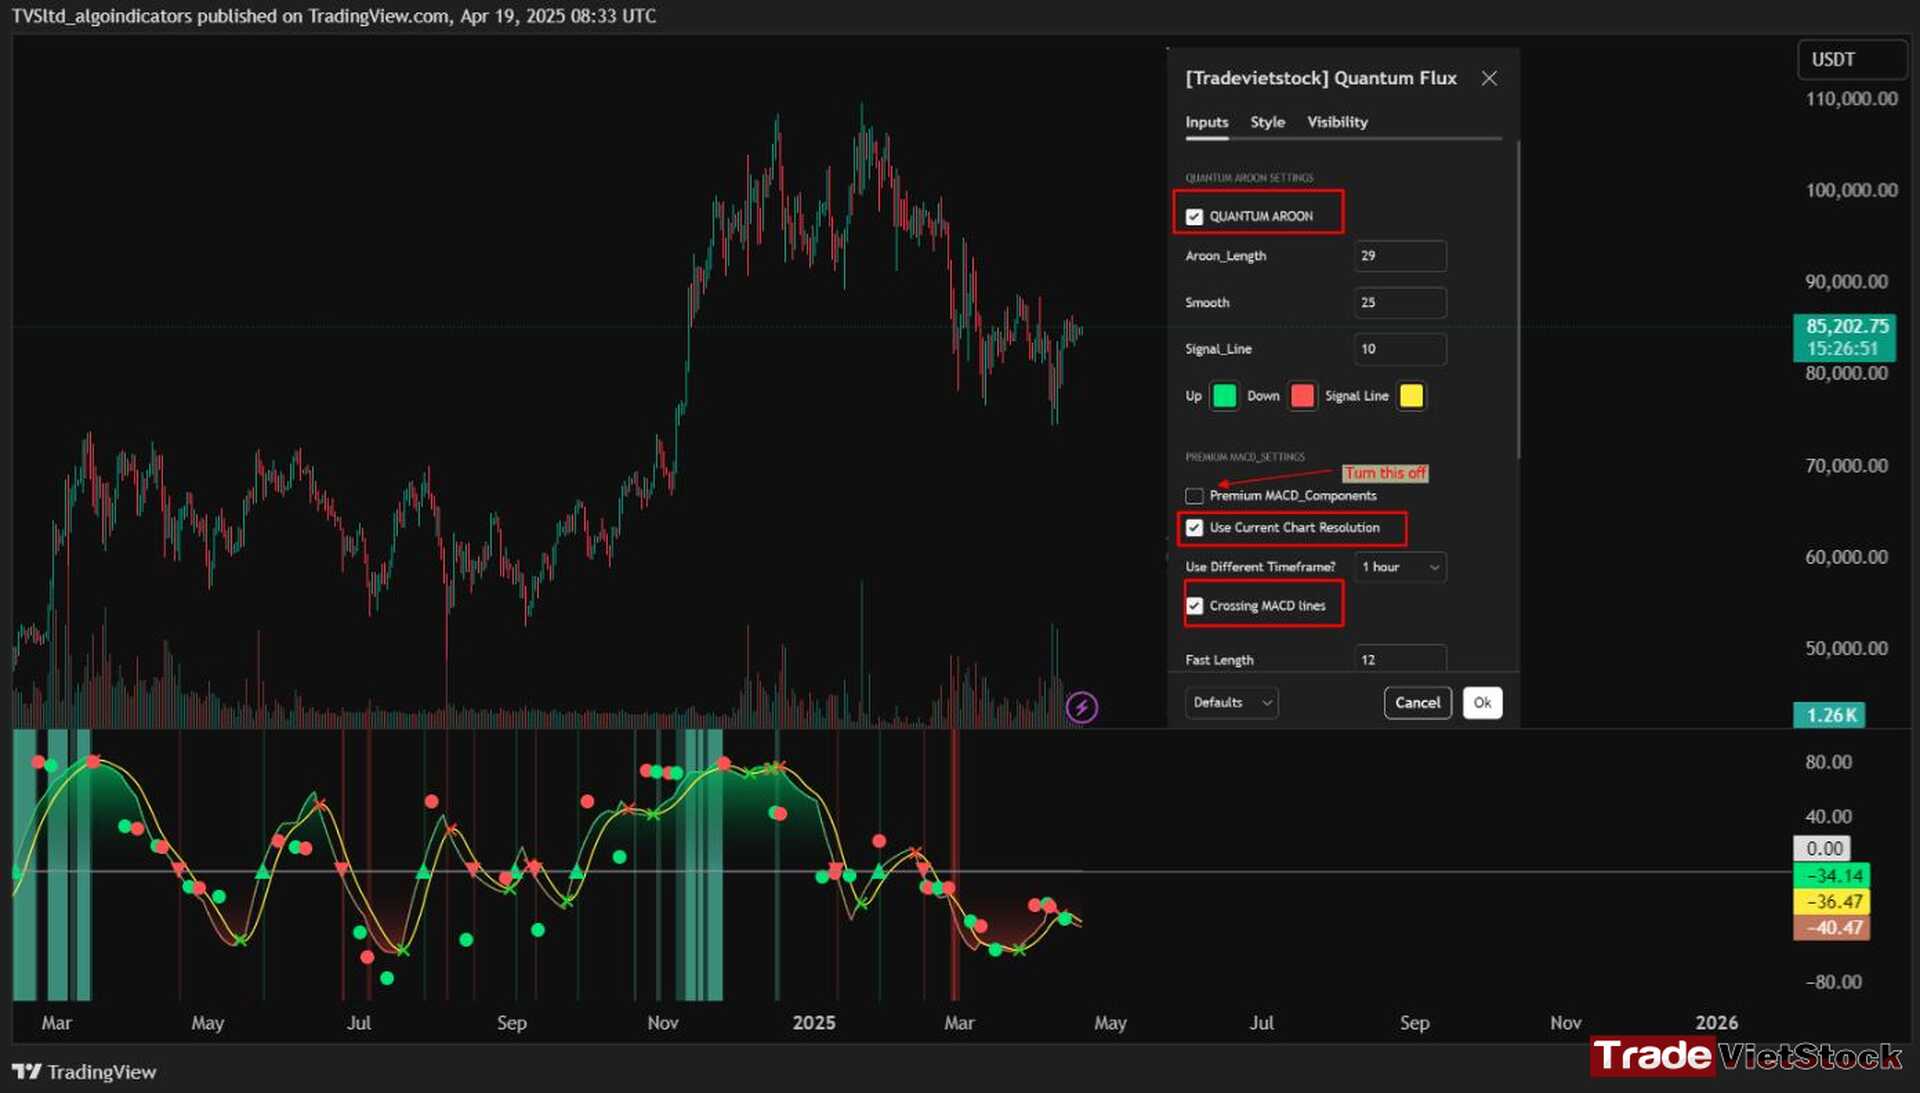
This includes both the Quantum Aroon and some of the Premium MACD signals. This full setup is ideal for traders who want a complete view of the market cycle with detailed signals. You just need to turn off the Premium MACD_Components as the image below
Turn Off Premium Macd Components For Our Default Setting To Use Quantum Flux – Cycle Detection Indicator for Trading (Tradevietstock)
MACD-Only Setup
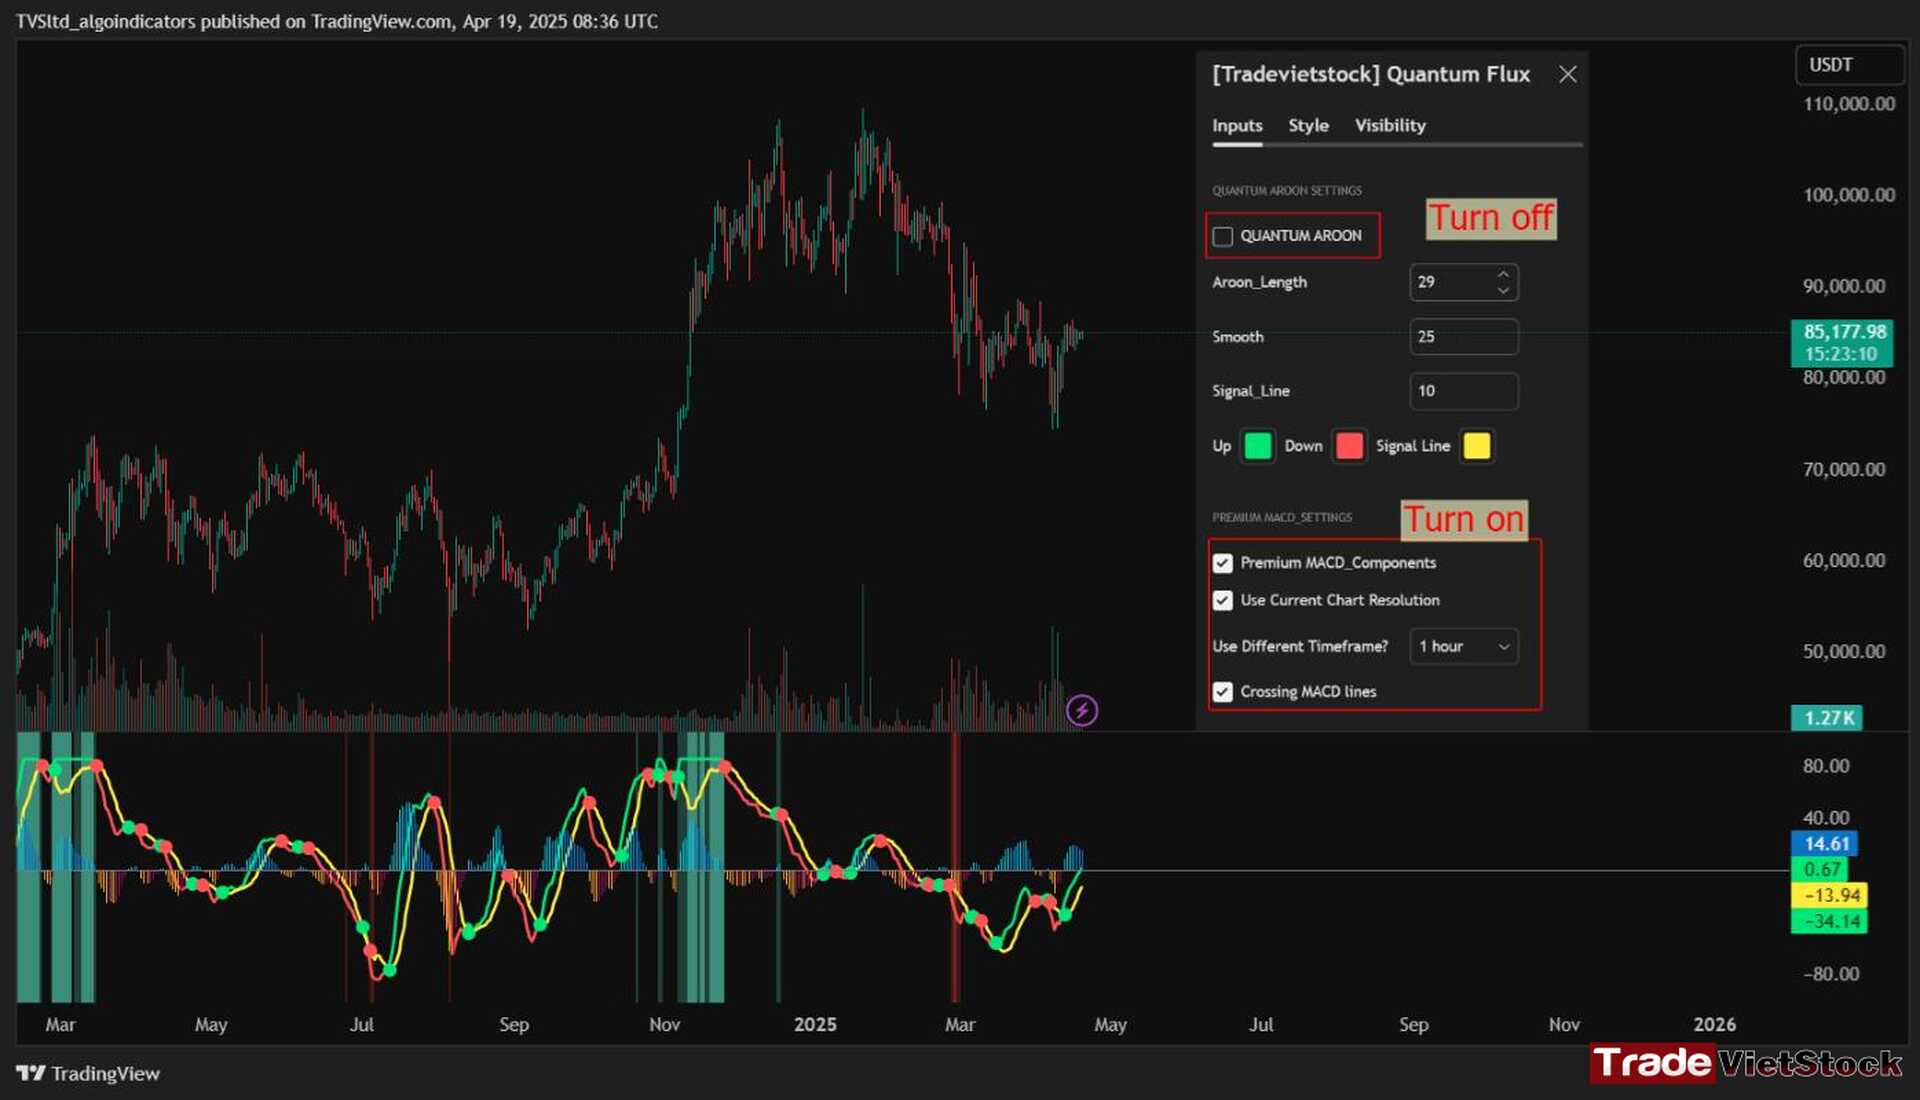
In this mode, the Quantum Aroon module is disabled. The indicator will rely solely on the Premium MACD Setting to generate signals. While this option is available, we recommend using the full setup for the most accurate performance.
Only Macd Setting Mode On Quantum Flux – Cycle Detection Indicator for Trading (Tradevietstock)
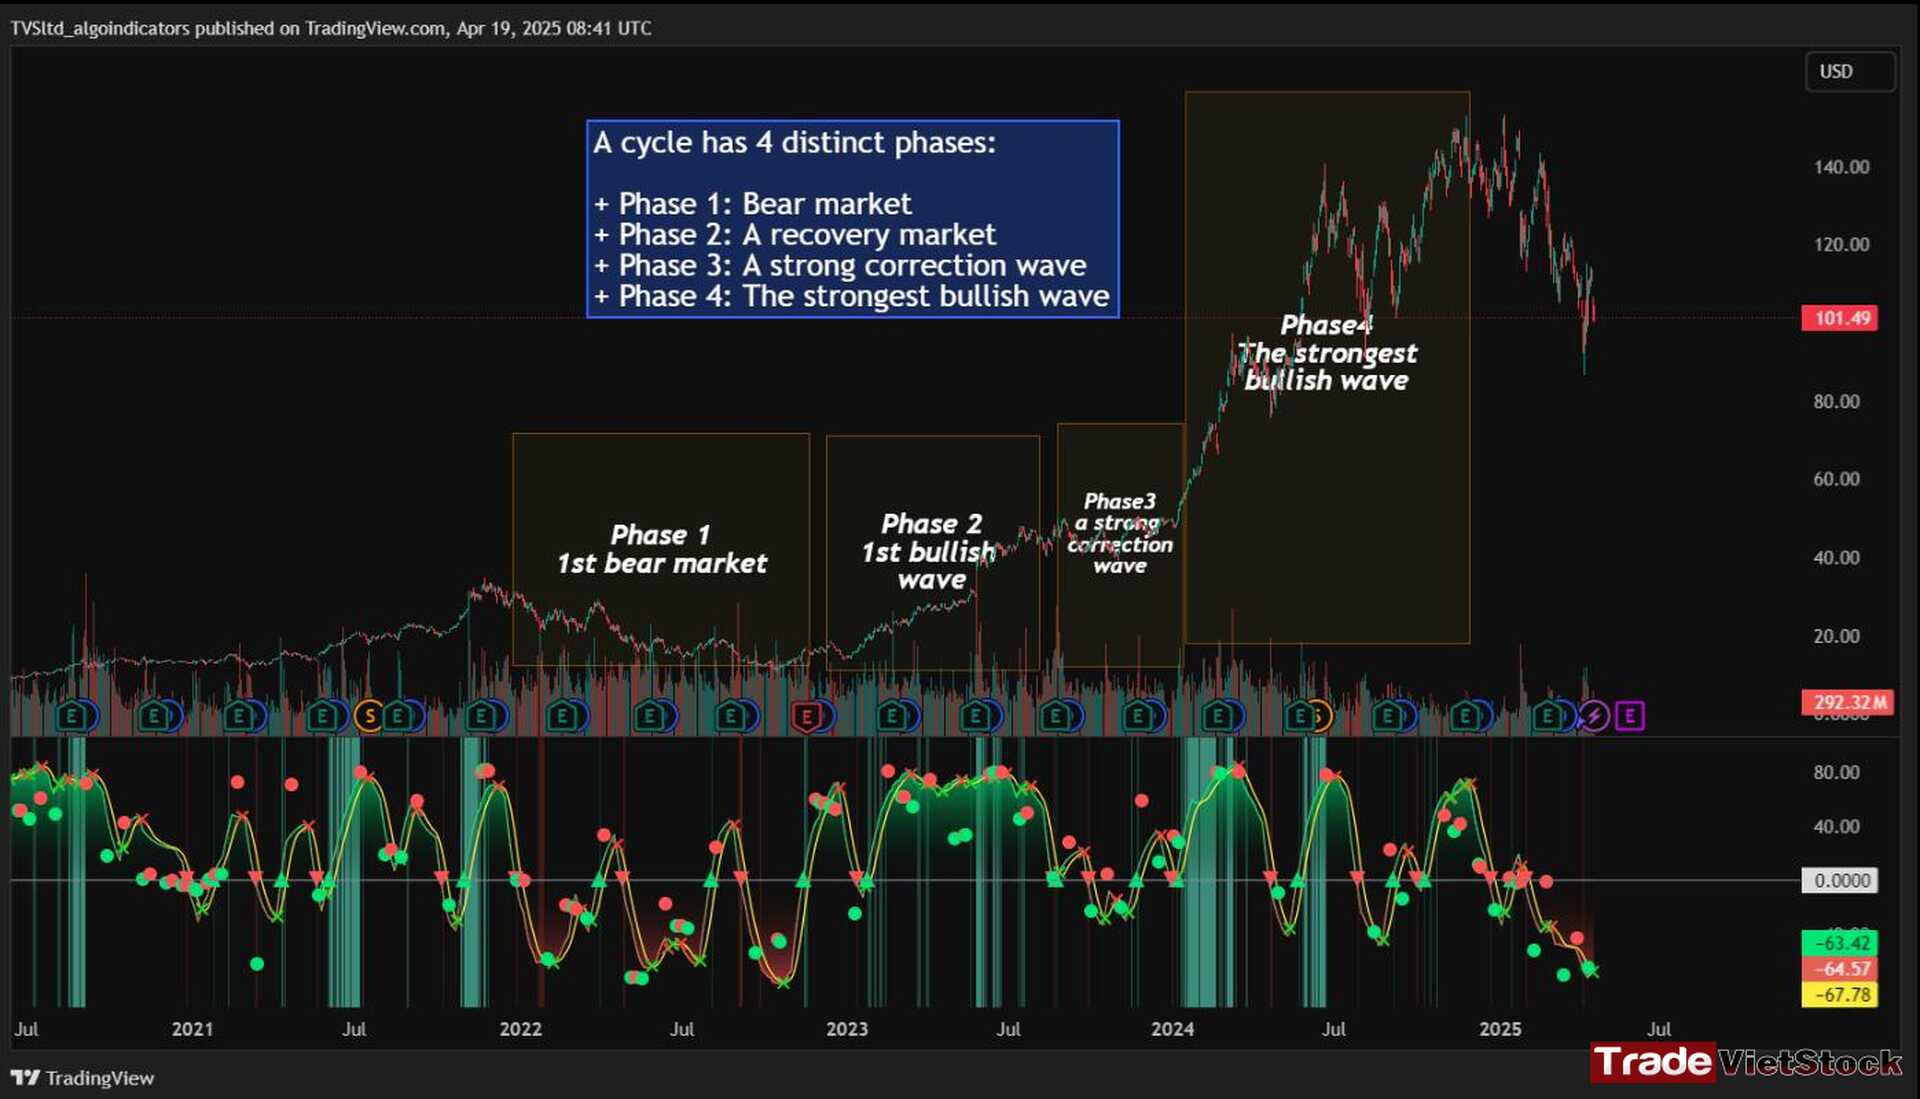
According to Tradevietstock’s theory, every trading asset typically moves through four distinct phases in a complete cycle:
Bearish Phase – Bear Market
First Bullish Wave – The Recovery
Strong Correction Phase
Final Bullish Wave
Quantum Flux generates visual and data-driven signals to help you time your trades accurately.
Green Dots: MACD crossover → Potential buy signal
Red Dots: MACD crossunder → Potential sell signal
Quantum Aroon Crossover: Confirms bullish trend or Buy Signals
Quantum Aroon Crossunder: Confirms bearish trend or Exit Signals
In the example of NVDA, you can observe all four phases in action. For medium- to long-term traders, Phase 2 and Phase 4 usually present the strongest buying opportunities. Phase 1 and Phase 3 are accumulation phases — where prices are lower and preparations are made for the next bullish leg.
Applying Market Cycle Theory To Nvda Stock – Cycle Detection Indicator for Trading (Tradevietstock)
We can examine the following example to better understand Phase 1: The Bear Market. This phase only begins after a prior uptrend in the stock price. It’s crucial to remember that Phase 1 is not the start of the overall trend—it marks the reversal following a bullish run.
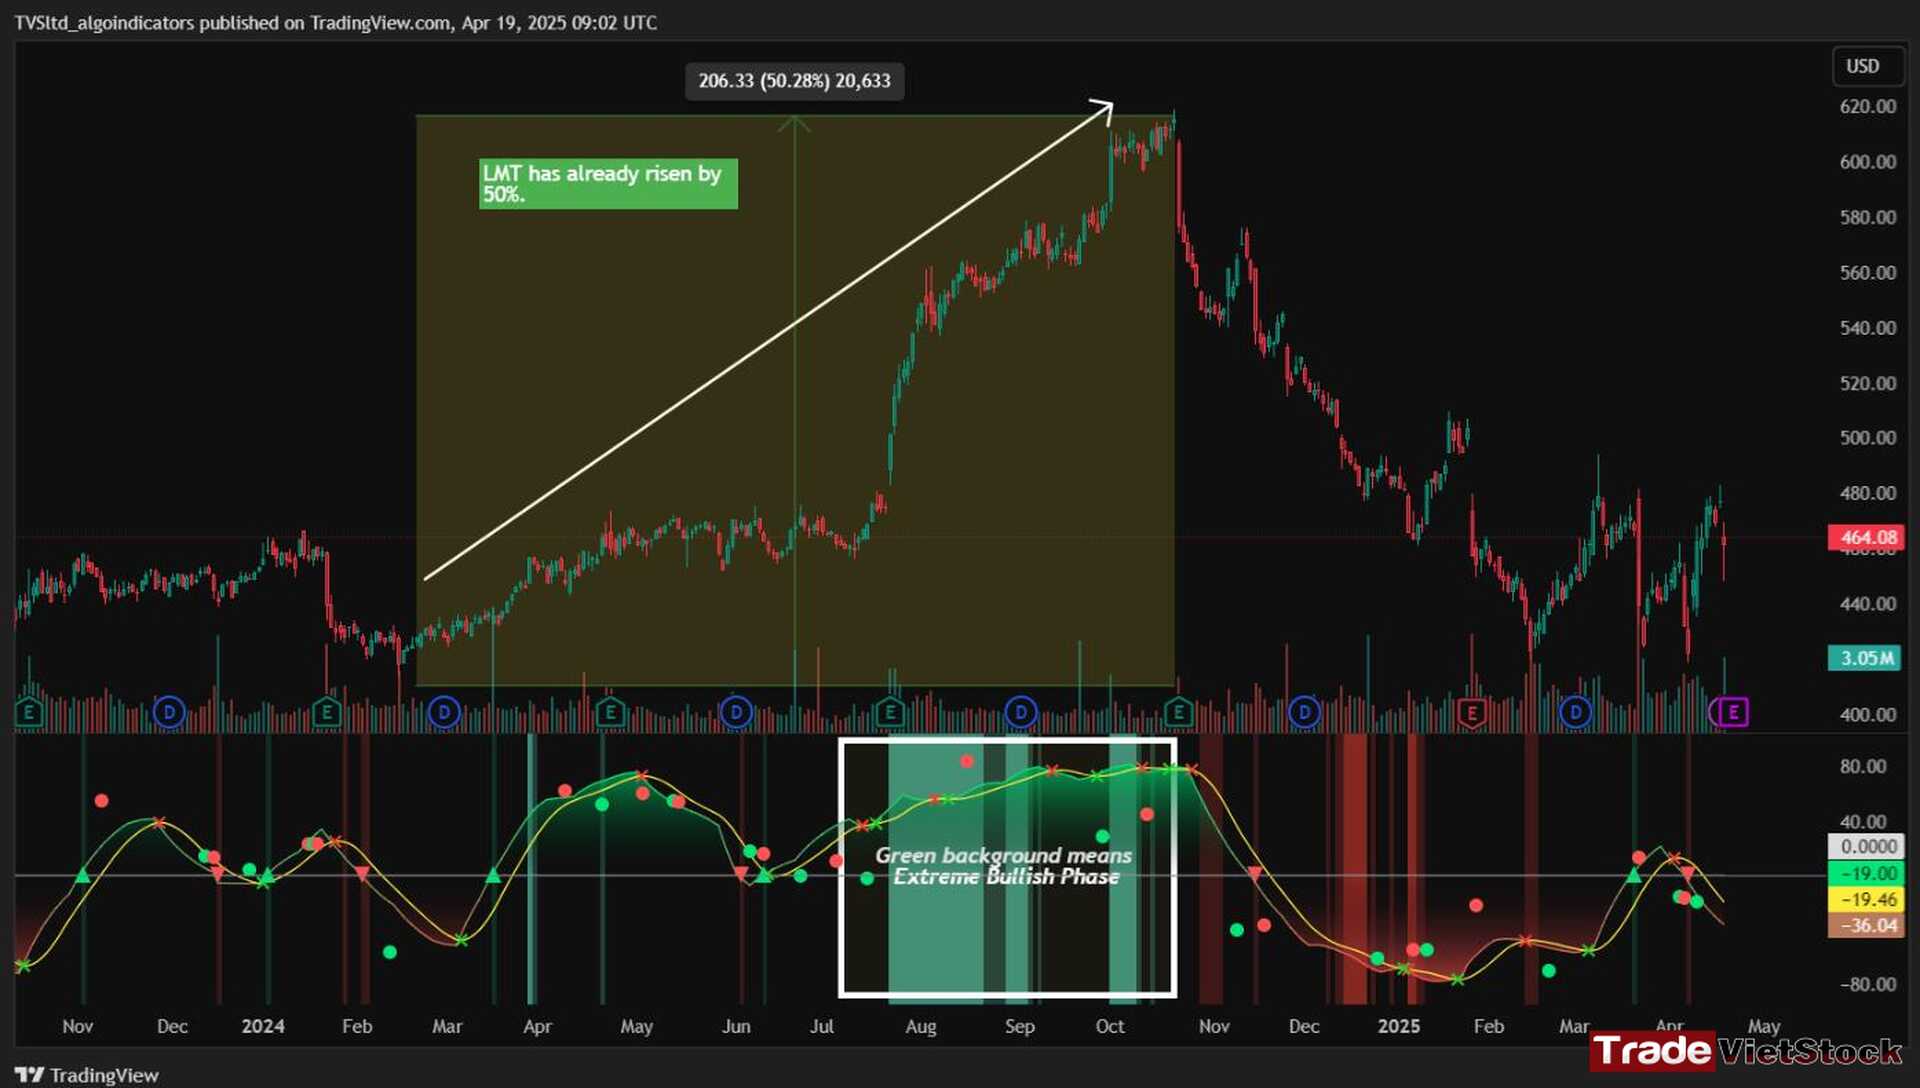
For instance, take the LMT stock: after a 50% rise, Quantum Flux displays a green background, indicating an ‘Extreme Bullish Phase’. Once this bullish phase concludes, it sets the stage for a valid Phase 1—the beginning of the Bear Market.
Market Cycle Theory Applied On LMT Stock After A Bear Market – Cycle Detection Indicator for Trading (Tradevietstock)
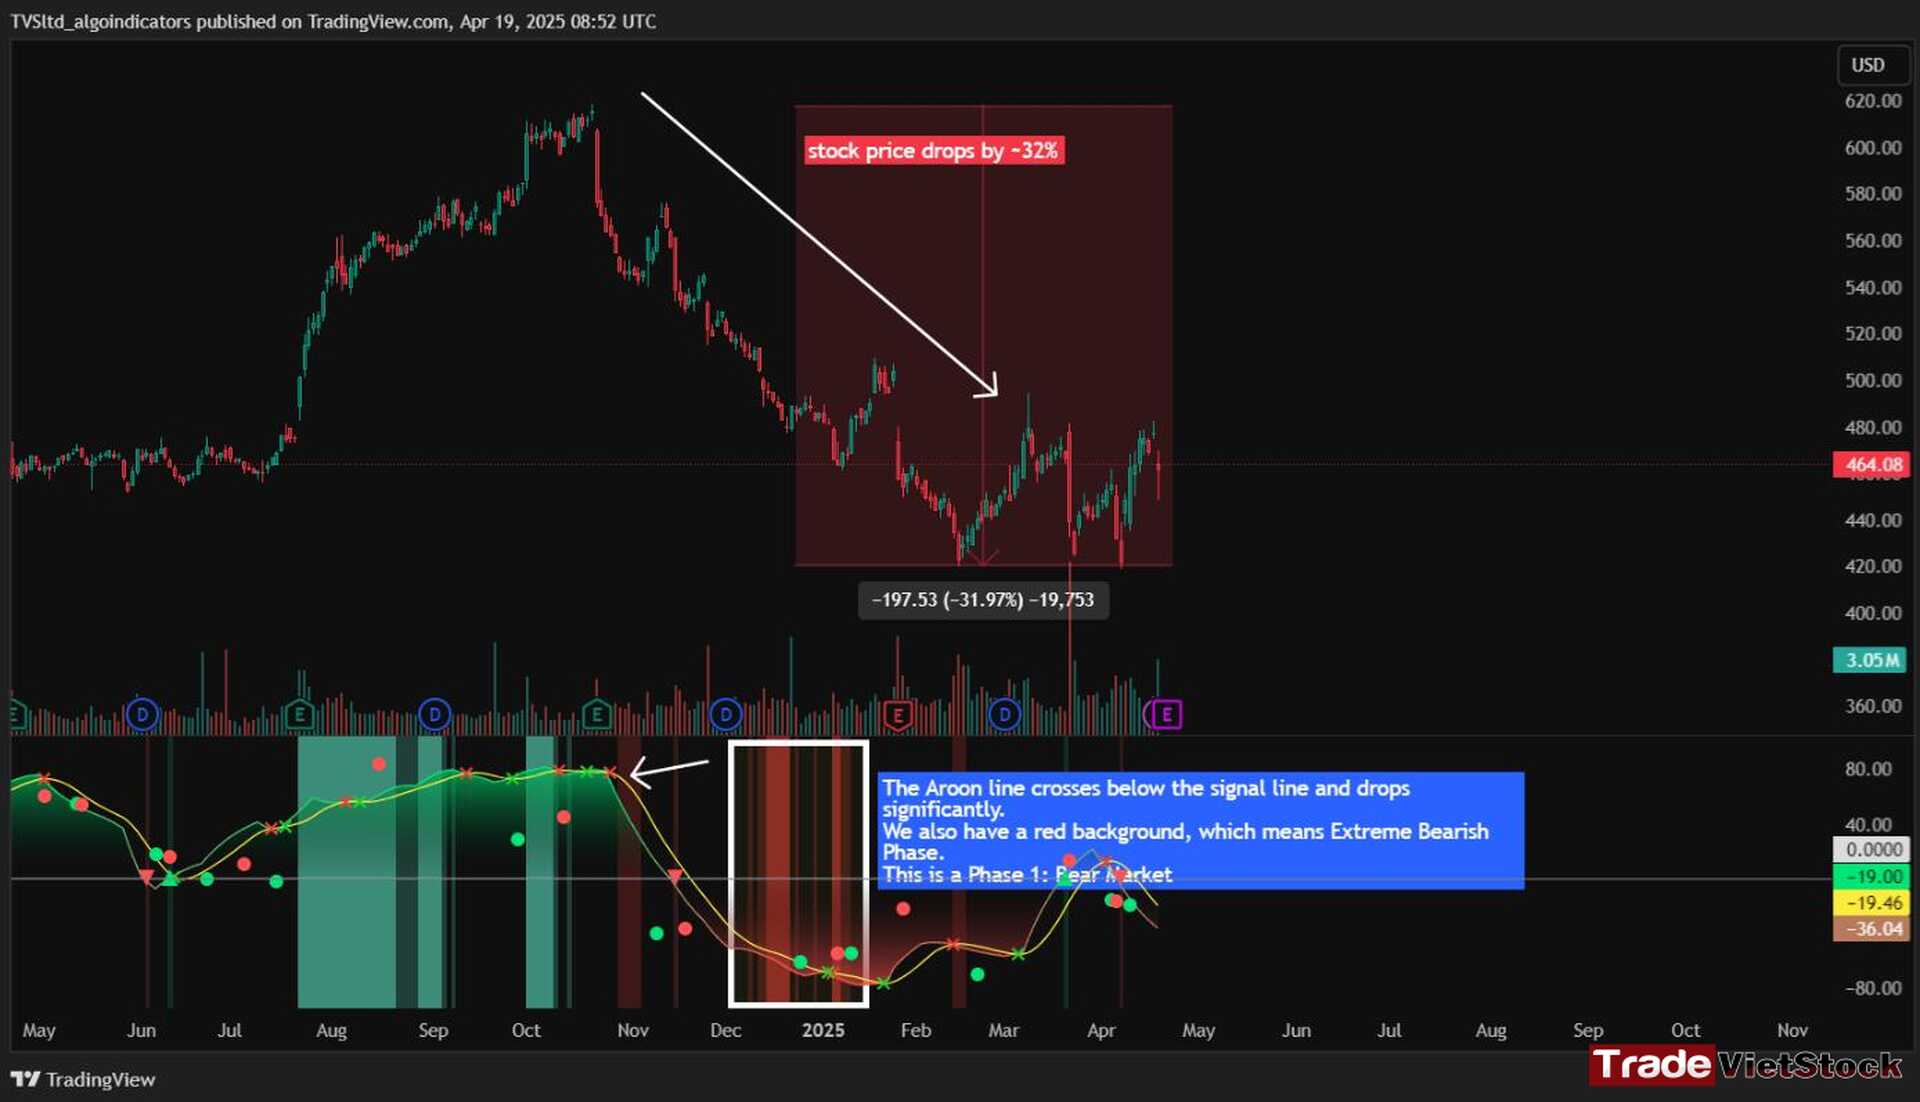
The stock price declines sharply, triggering Quantum Flux to display a red background as the Aroon line crosses below the signal line.
Identify The Bear Market Of The Stock With LMT As An Example – Cycle Detection Indicator for Trading (Tradevietstock)
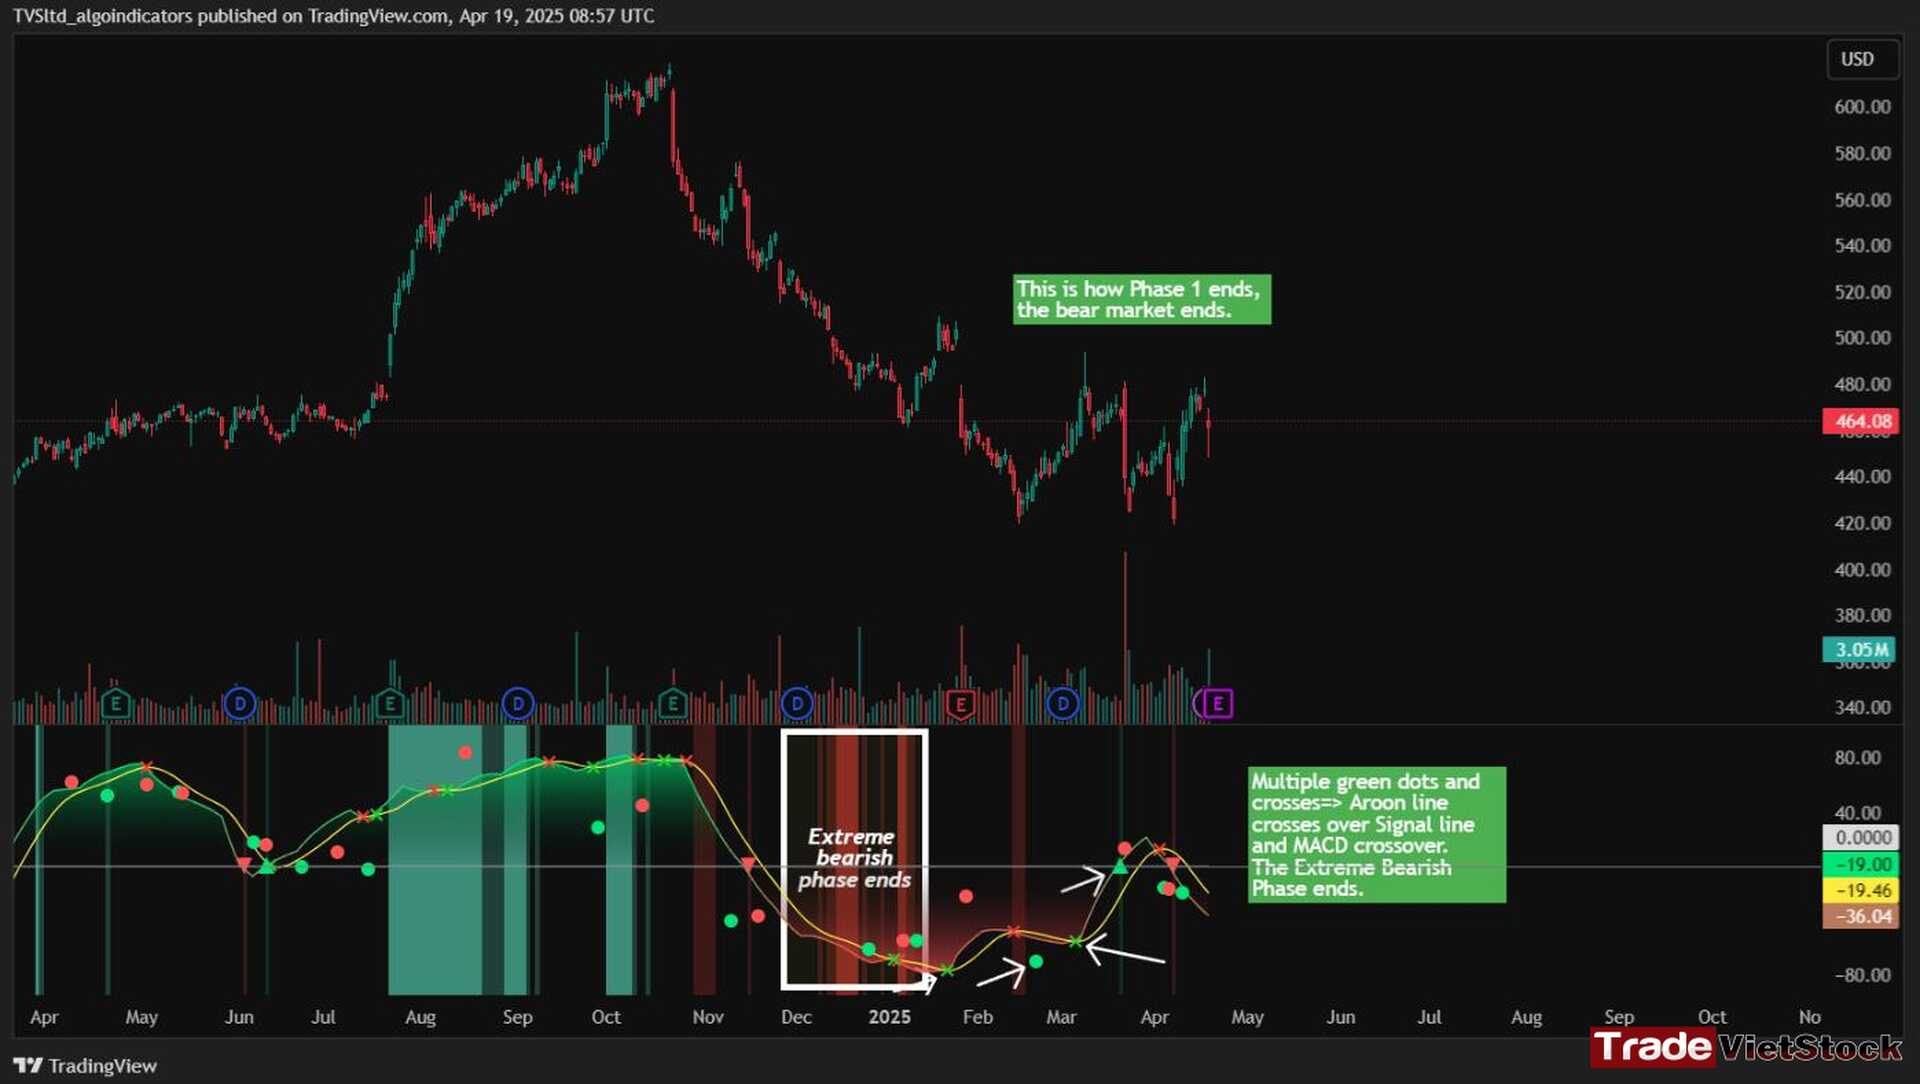
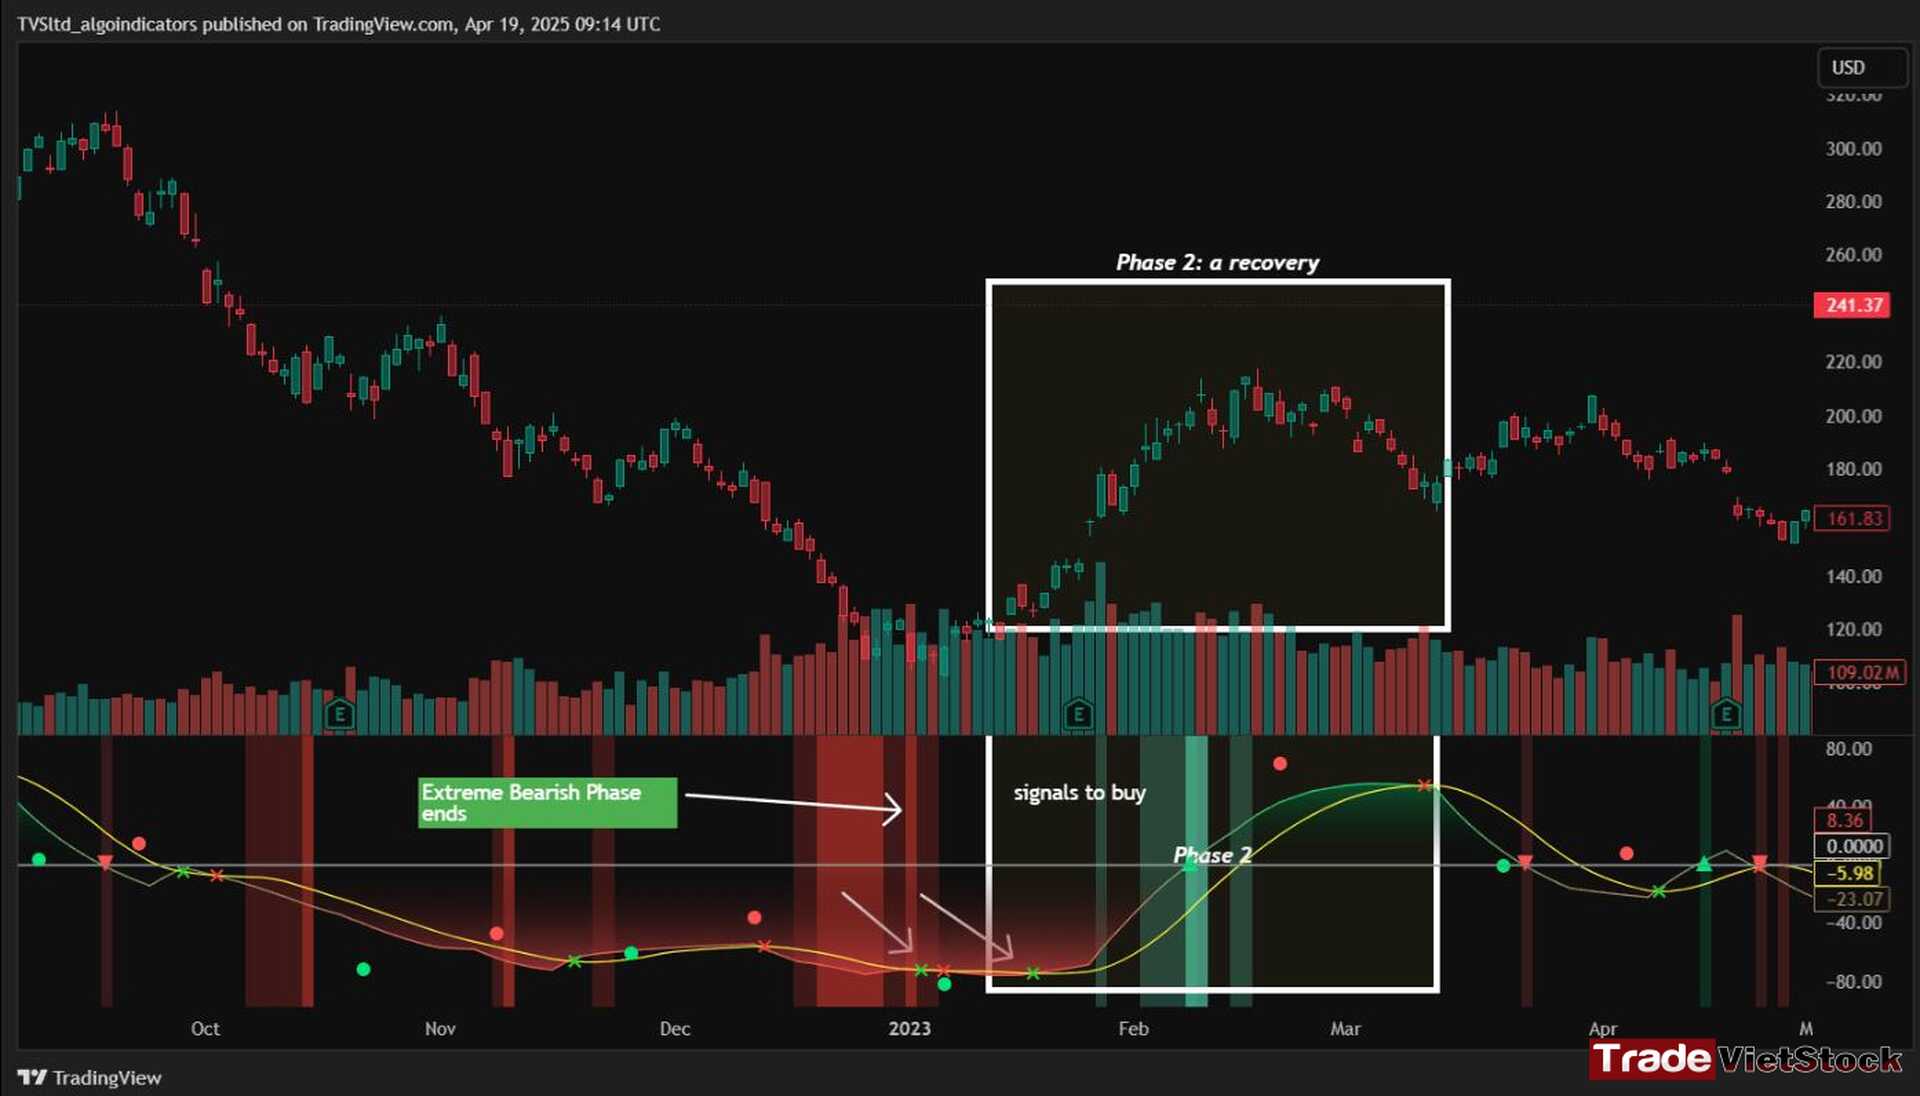
Phase 1 concludes when we observe multiple crossover signals—most notably when the Aroon line crosses above the Signal line—and the red background, which signifies the Extreme Bearish Phase, disappears. Let’s take a look at the image below:
Buy Signals At The End Of A Bear Market With LMT As An Example – Cycle Detection Indicator for Trading (Tradevietstock)
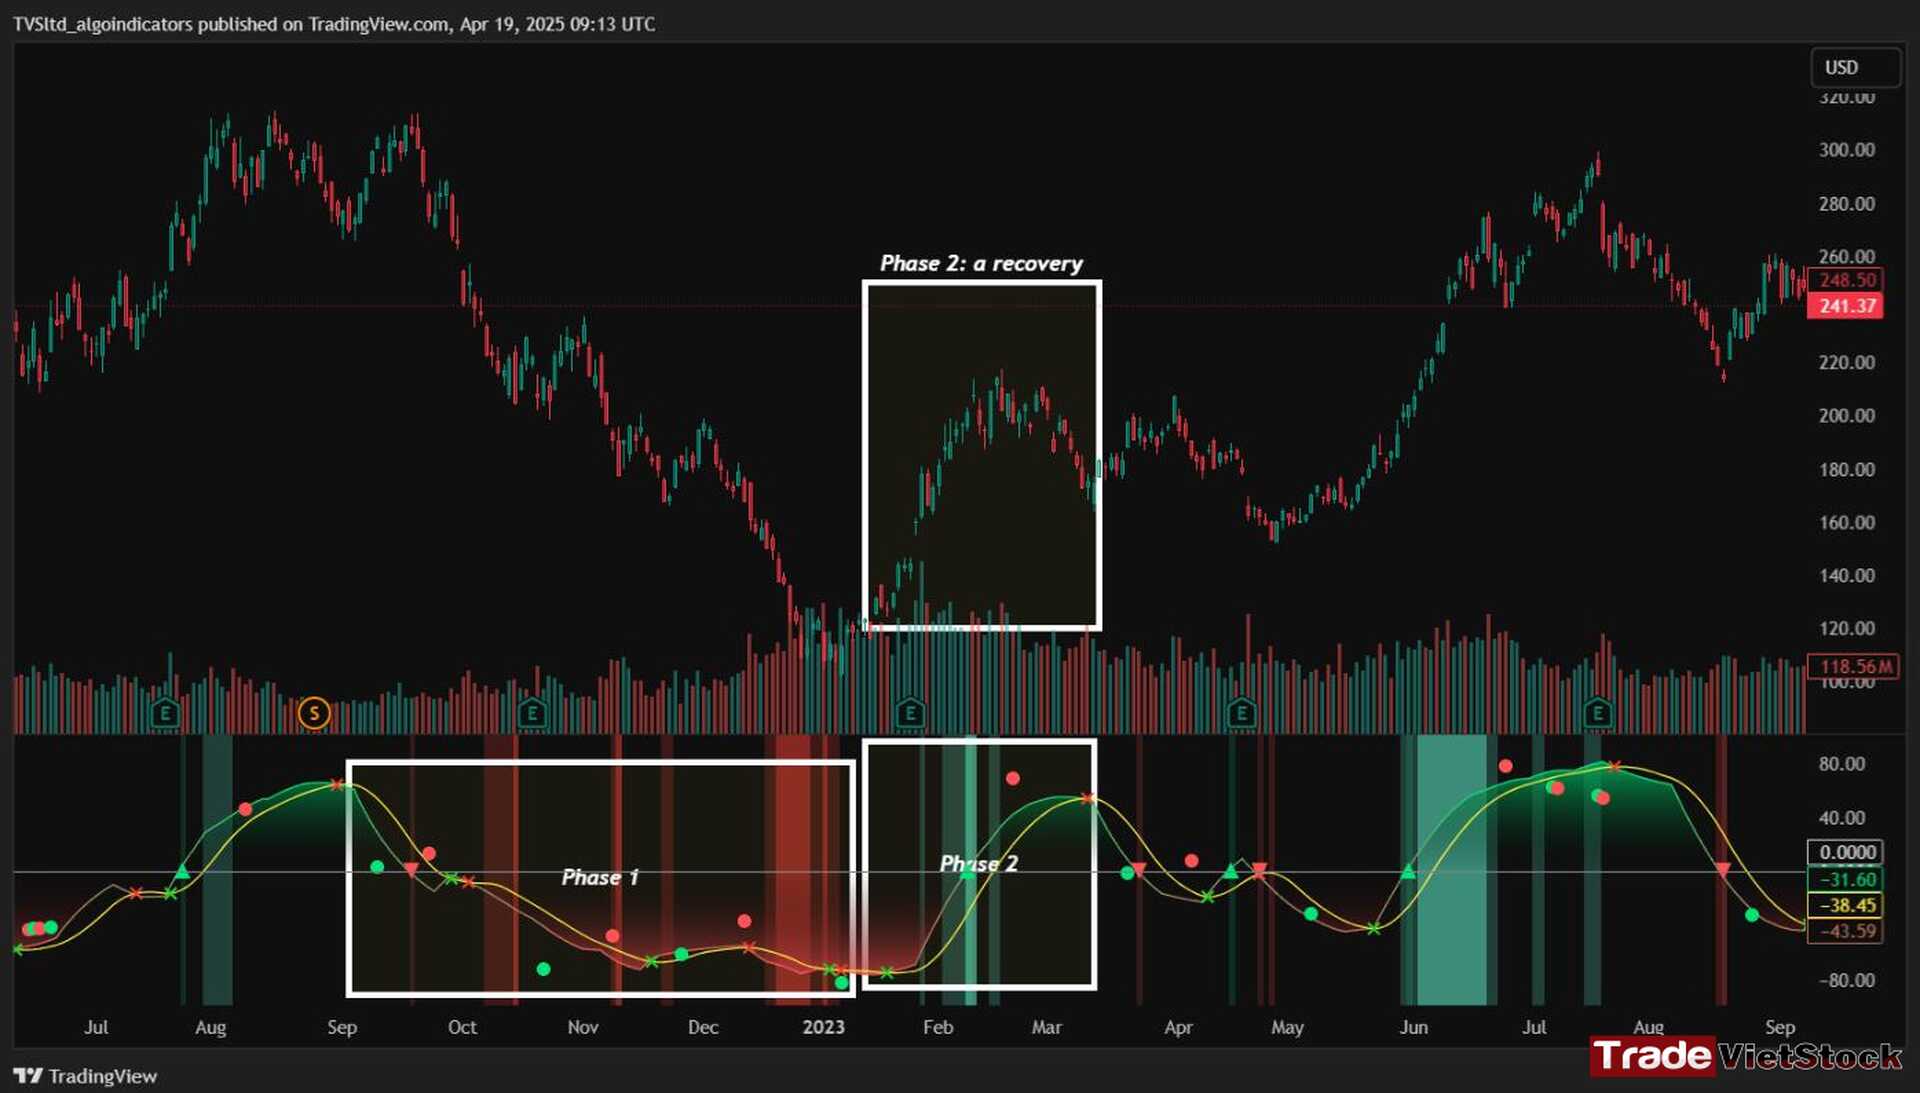
Let’s move on to Phase 2: The Recovery. This phase follows the Bear Market—Phase 1. After a significant decline in the stock price, a recovery or pullback is expected.
Applying Market Cycle Theory To TSLA During Its Recovery Phase – Cycle Detection Indicator for Trading (Tradevietstock)
Our signals for this phase include green dots and crosses, along with the confirmation signals that mark the end of Phase 1. This combination provides valid Buy signals and presents opportunities for mid-term investment strategies.
Buy Signals At The Beginning Of A Recovery With TSLA As An Example – Cycle Detection Indicator for Trading (Tradevietstock)
Phase 3 is a correction wave after the recovery. We also incorporate the cross and dot signals during this phase. In Phase 2, the strategy involves preparing to sell or take profits once the recovery phase matures. Whenever red dots or red crosses appear, they serve as indicators to consider taking profits, signaling the potential end of the upward move.
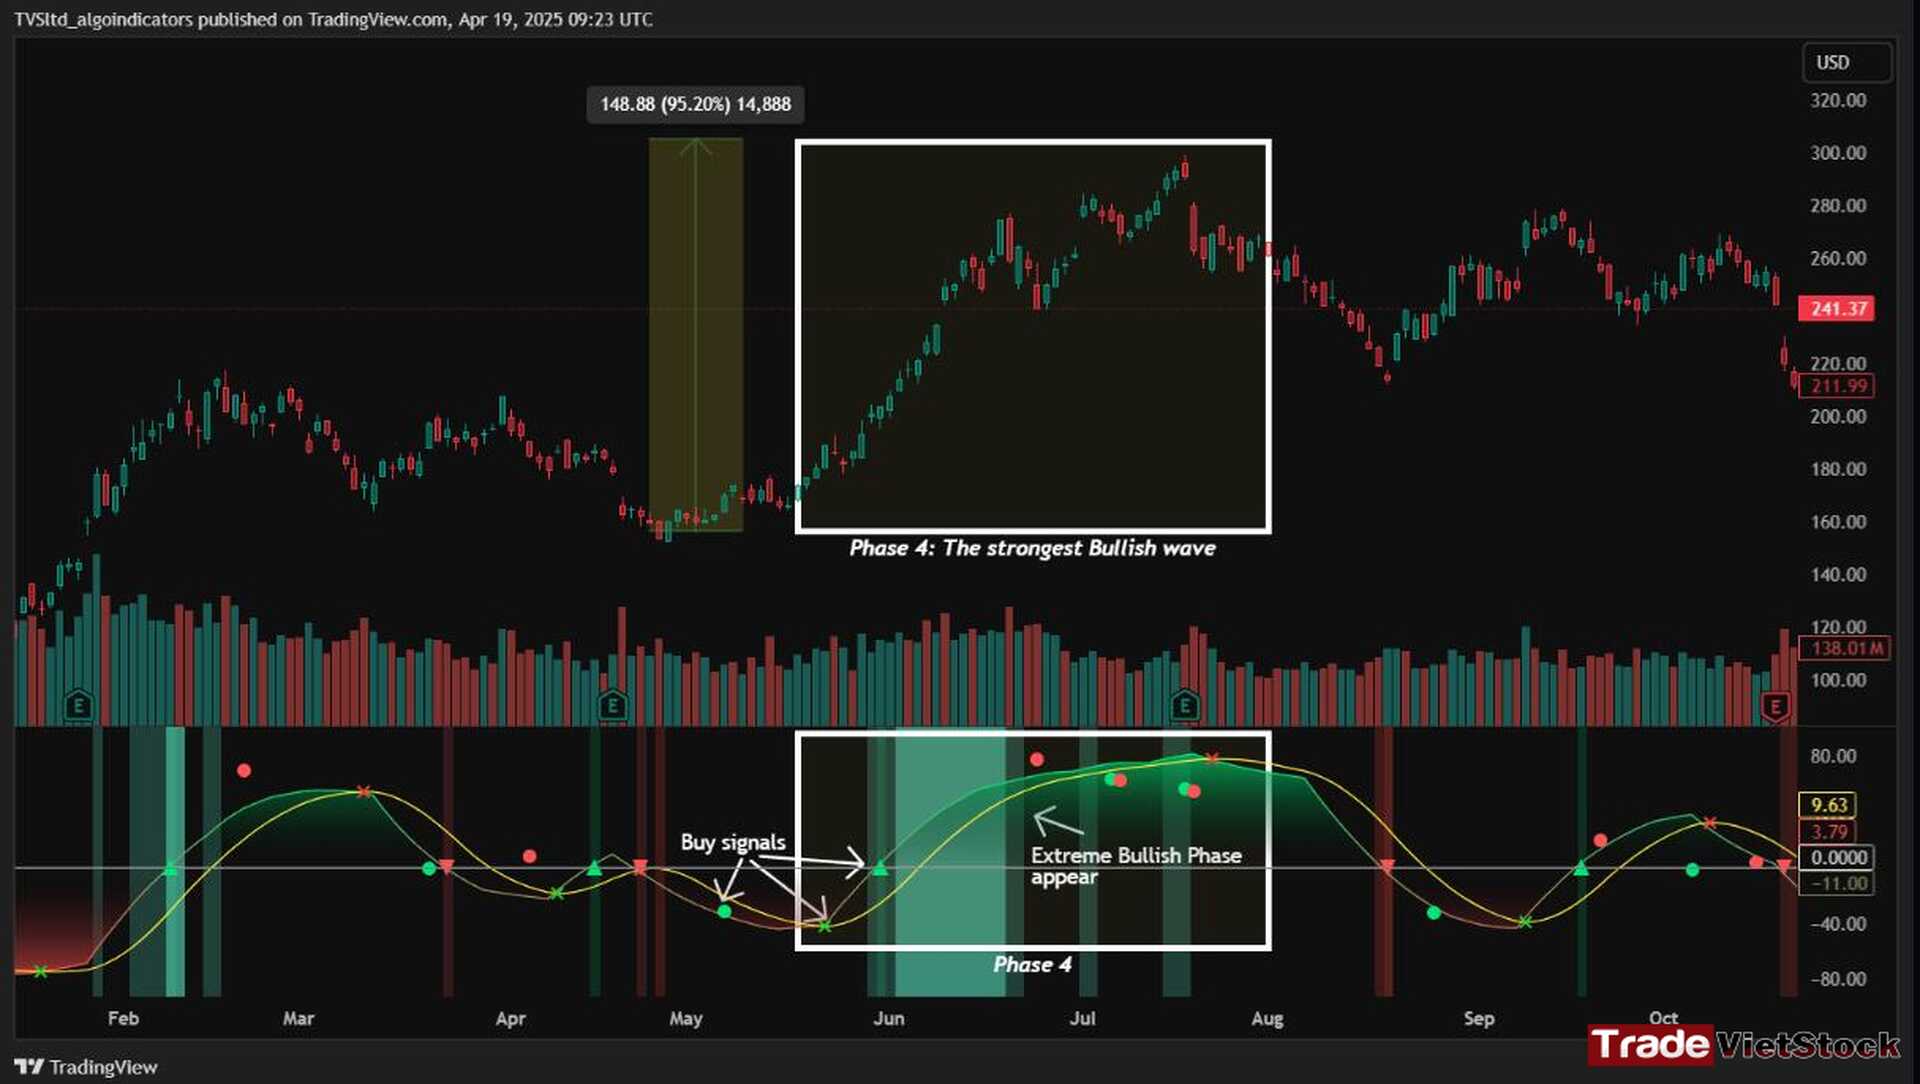
In Phase 3, known as the correction wave, the key objective is to take profits before the price begins to decline. This phase represents a temporary pullback following the recovery. Importantly, the end of Phase 3 often presents a strong buying opportunity—just before the onset of Phase 4, which is the strongest bullish wave. Whenever green dots and crosses appear at this stage, they serve as clear Buy signals, allowing us to position early for the upcoming bullish momentum.
Sell Signals At The End Of The Recovery Phase With TSLA As An Example – Cycle Detection Indicator for Trading (Tradevietstock)
Phase 4 is the strongest bullish wave—one that investors definitely don’t want to miss. Having entered at the end of Phase 3, the goal in Phase 4 is to maximize gains by targeting the highest highs.
Buy Signals During The Strongest Bullish Wave With TSLA As An Example – Cycle Detection Indicator for Trading (Tradevietstock)
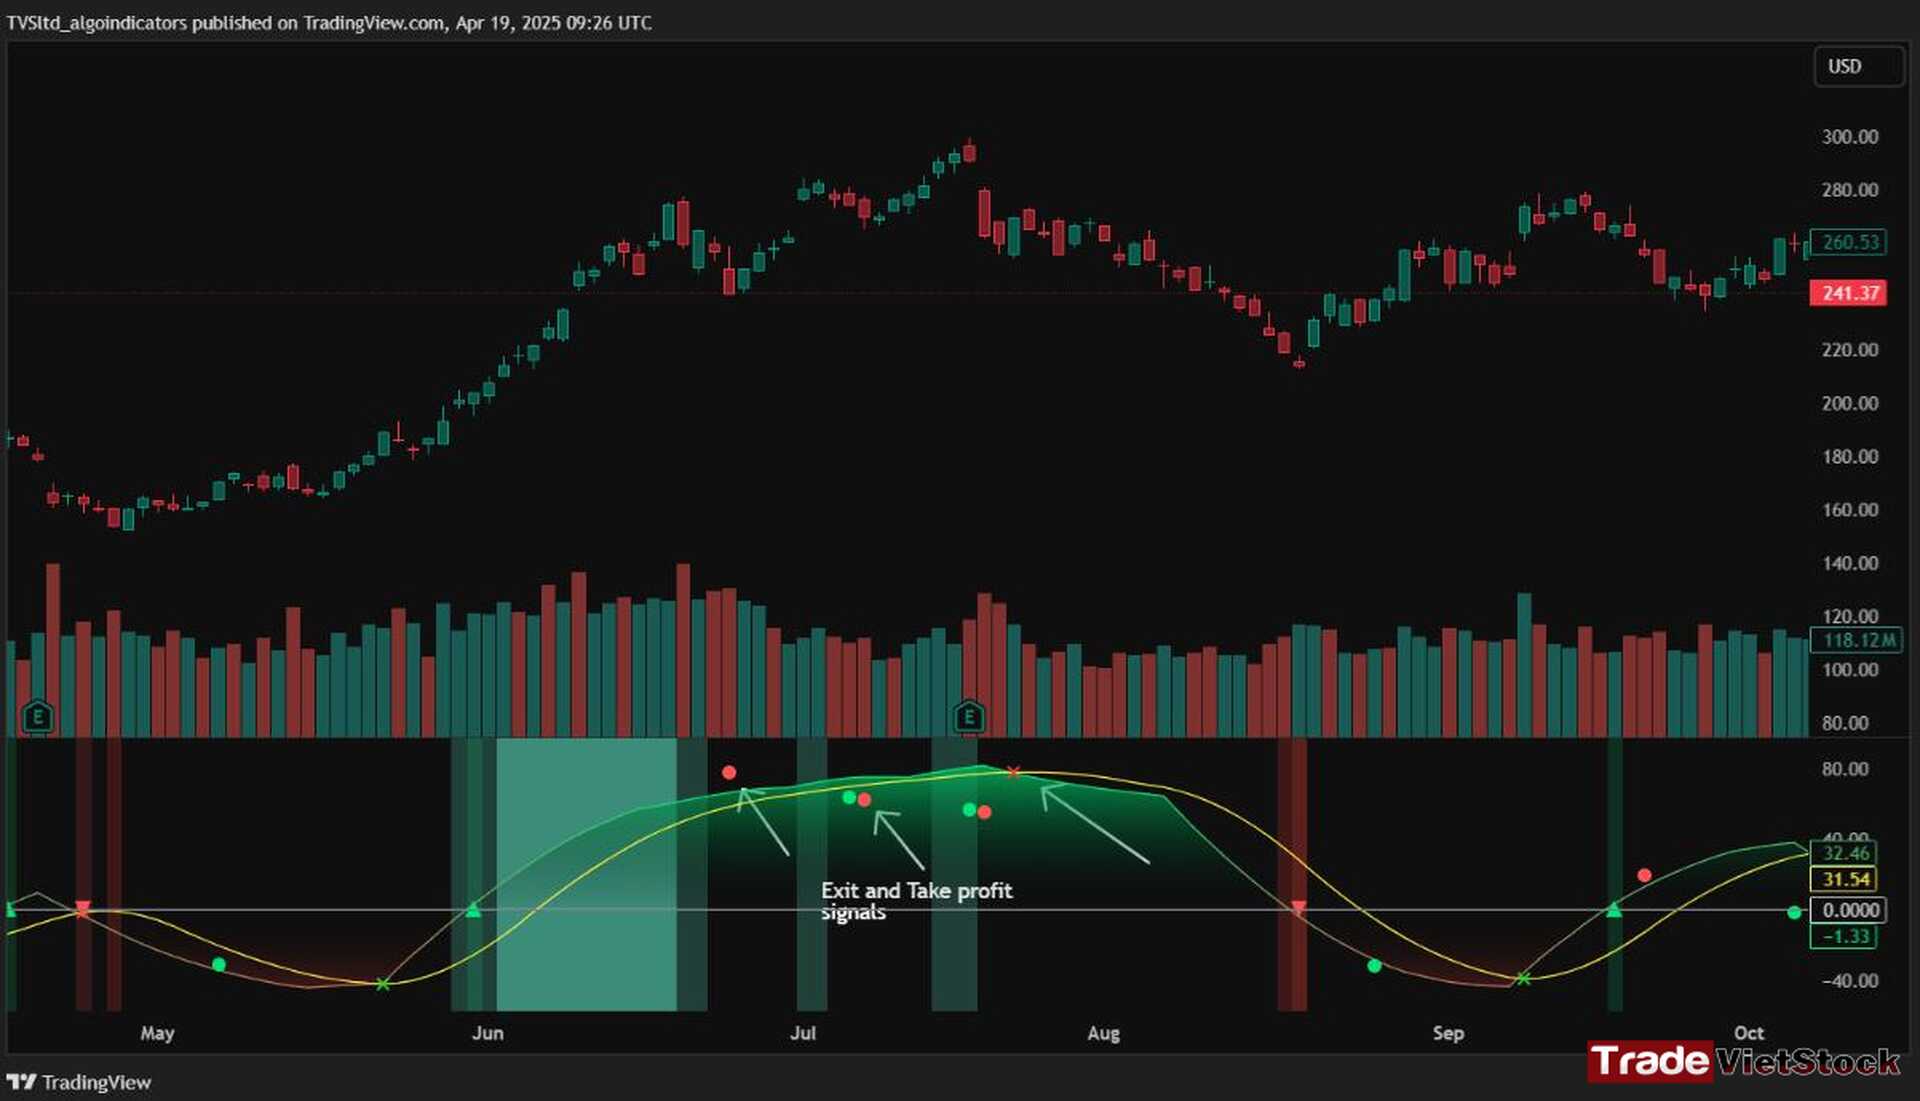
During this phase, we closely monitor our exit signals, which include the appearance of red dots and red crosses, as well as the disappearance of the Extreme Bullish Phase indicator (green background). These signals help us lock in profits at the peak of the bullish momentum.
Exit Signals During The End Of Phase 4 With TSLA As An Example – Cycle Detection Indicator for Trading (Tradevietstock)
iii. Brief Conclusion on the Signals
1. End of Phase 1:
As Phase 1 nears completion, green dots start to appear. These serve as early entry signals, offering an opportunity to buy at lower prices before the trend reversal begins.
2. Phase 2 – Recovery:
Momentum begins to build during this phase. As it approaches its peak, red dots and Aroon line crossunders emerge—signaling that it’s time to exit or reduce exposure in anticipation of a correction.
3. Phase 3 – Correction:
The indicator typically shows a red background, reflecting a bearish environment. This is a waiting phase—traders should remain cautious and avoid entering until green signals reappear.
4. Phase 4 – Strong Bullish Wave:
With the return of bullish signals (green dots, crosses, and green background), Phase 4 begins. After entering, the position is held to ride the strong momentum. Profit-taking signals include the appearance of red dots, red crosses, and the disappearance of the green background.
iv. Optimal Use by Market Type
Here’s how we suggest using QFI depending on what you trade:
Stocks: Best used on the Daily or Weekly chart for swing trades.
Cryptocurrency: Works well on BTC, ETH, or major altcoins using Daily and Weekly charts. Great for catching larger trend reversals.
CFDs and Forex: QFI is built for higher timeframes (H4, D1, W1), where it produces cleaner and more reliable signals.
Best Ways to Use It
🟢 Stocks
Works well on Weekly and Daily charts for swing entries
🟡 Crypto
Works best on Weekly and Daily charts
Good for trend-catching on BTC, ETH, or altcoins
🔴 CFDs
Designed with precision in mind — works on bigger timeframes, like H4, D1, and W1
The Quantum Flux Indicator – The best cycle detection indicator for trading – is a flexible and powerful tool for anyone looking to navigate the full market cycle — from bottom to top and back again. With its ability to highlight key phases and generate timely signals, it becomes easier to plan your entries, hold through trends, and exit with confidence.
Dowjones With Market Cycle Theory – Cycle Detection Indicator for Trading (Tradevietstock)
If you’re serious about understanding market structure and improving your timing, Quantum Flux, the best cycle detection indicator for trading, can become a central part of your strategy — no matter what market you’re in.
Ready to level up? Purchase our monthly plan right now
1 review for Cycle Detection Indicator for Trading


 Tiếng Việt


Tien –
like