When will gold stop rising
| Date: 17/04/2025 | 1690 Views | Investment and Trading Academy, Investment and Trading Signal |
When will gold stop rising – When to sell gold and start investing in other assets
Hey everyone, Tradevietstock is back again! Today, I’m diving into gold investing after a hot streak in gold prices, with everyone in the media talking about it. There’s even some unofficial info and rumors claiming gold could reach 6,000USD per ounce. But what data shows that gold prices will continue to rise dramatically, maybe even double? And, more importantly, when will gold stop rising? And what is the exact time to sell it and take profit? Let’s break down the data below.
Our view at Tradevietstock is that gold won’t keep climbing like that. Instead, this is the time to look for opportunities to sell at the best price. FOMO (fear of missing out) at this point, chasing gold at its peak, can lead to significant losses, especially if you’re a short-term speculator.
Looking at recent movements, XAUUSD has surged for three consecutive sessions, each by around 3%. To me, this signals strong FOMO in the gold market—not a good sign for new buyers.
i. Gold Price History
1. Historical Data from 1970
Gold has seen significant spikes in the past, similar to the recent surge. Below is a summary of gold price history from 1987 to present, highlighting periods of strong consecutive increases and other key benchmarks.
2. The historical context at key moments
| Year | Important Dates | Key Events | Factors Affecting Gold Price |
| 1987 | May 18, Aug 3-4, Oct 19, Nov 27-30, Dec 10 | Black Monday (Oct 19) | Market crash, safe-haven demand, inflation concerns, weak USD, trade imbalances, loose monetary policy. |
| 2004 | Jan 5, Mar 22-31 | Gold surpasses $400 | Weak USD (-15% in 2003-04), Iraq war instability, rising oil prices, US budget deficit concerns. |
| 2005 | Nov 17-28, Dec 5-28 | Gold surpasses $500 | Weak USD, strong investment demand, commodities market strength, inflation concerns. |
| 2006 | Jan 3-9, Feb 9 | Continued gold price rally | Weak USD, Middle East tensions, speculative trading. |
| 2008 | Jan 10 – Mar 26 | Global Financial Crisis | Bank failures (Bear Stearns), USD volatility, safe-haven demand. |
| 2010 | Jun 7, Oct 29, Nov 8-30 | Fed’s QE2 announcement, Eurozone debt crisis (Greece, Ireland) | Weak USD, geopolitical tensions, gold surged to ~ $1,400. |
| 2011 | Feb 21 – Sep 2 | Gold market peak | US debt ceiling crisis, Eurozone instability, Middle East unrest (Arab Spring), gold peaked around $1,900. |
| 2025 | Jan 21 – Apr 11 | Fed rate cut forecast, geopolitical tensions (Middle East, Ukraine), US tariffs on countries | Extremely high FOMO in gold. |
=> As we can see from the events above, gold tends to rise during periods of financial instability and geopolitical tension. However, from 2022 to now, gold prices have almost doubled, and all macroeconomic negative news has been priced in. So, when will gold stop rising and when to sell it?
ii. Probability Data
1. Quantitative Statistics
Below is a statistical comparison of XAUUSD gold prices with similar strong price movements observed in April 2025:

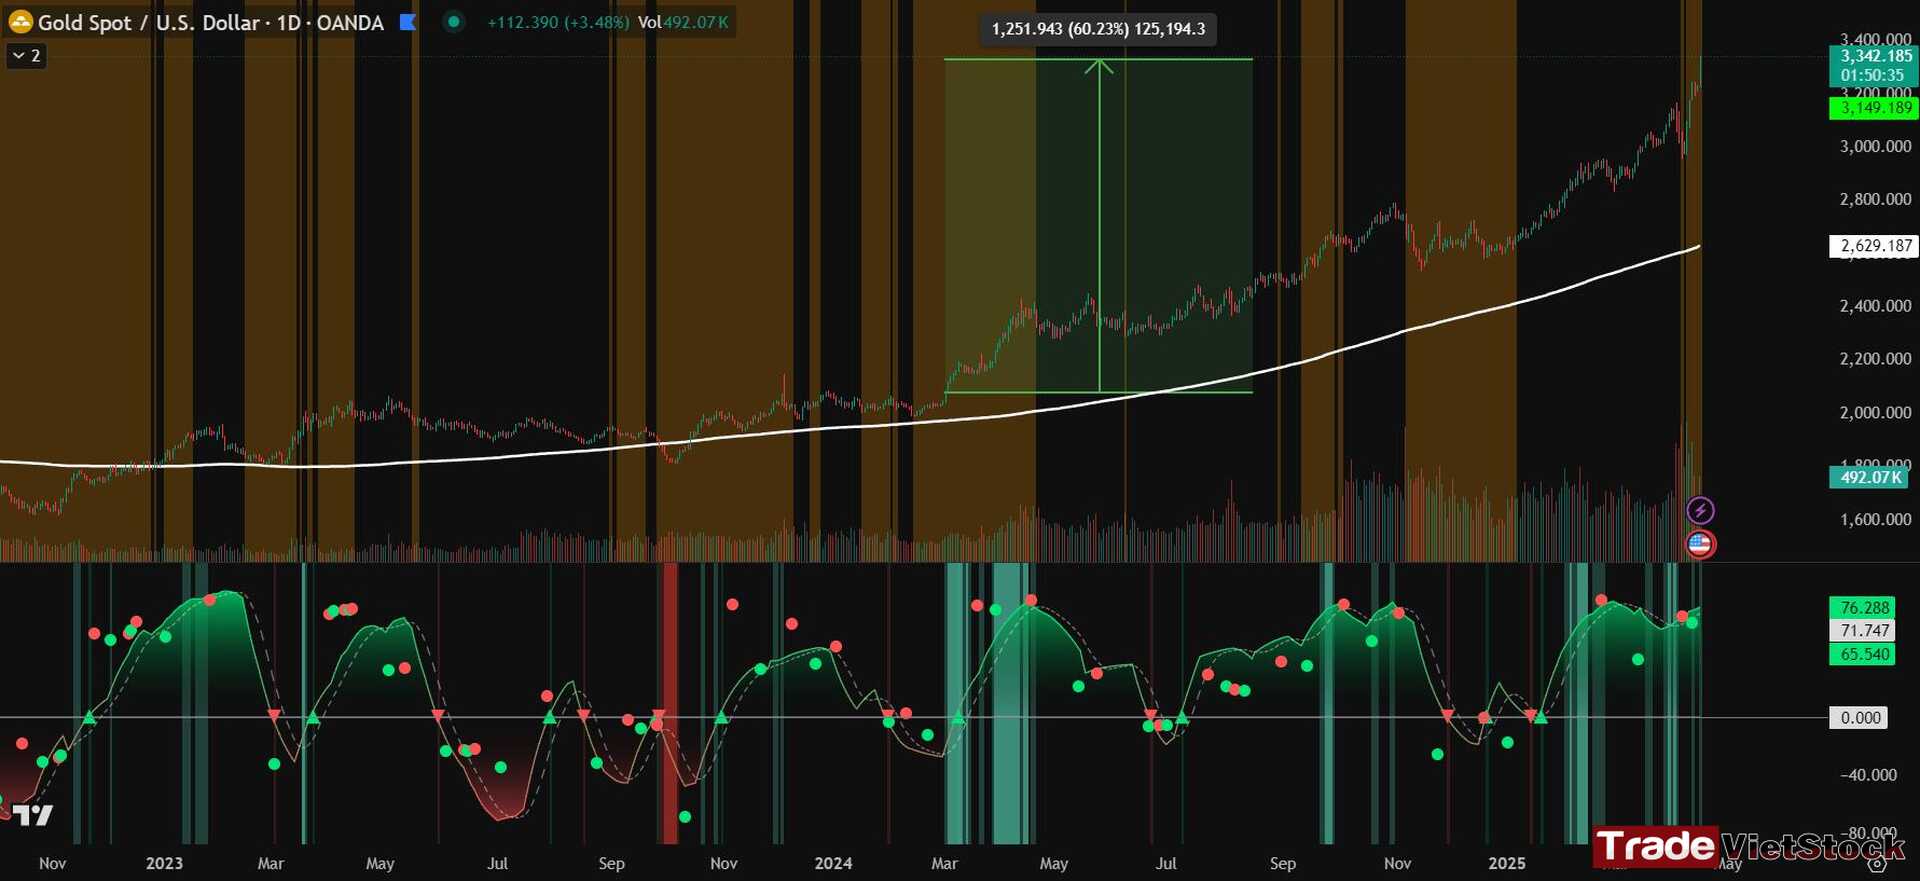
Looking at the data, we can see that gold prices generally decrease from the 30th session onward, after experiencing a 3% increase each session. The 30th session begins on April 9, 2025. Additionally, since 2024, gold has increased by more than 60%.

2. Probability Results
Based on probability calculations from April 9, 2025, the opportunity to buy new positions in XAUUSD is virtually gone. After the 10th and 30th sessions, it’s no longer advisable to enter new positions. Instead, it’s time to look for sell positions or lock in profits.

=> Since the cycle began, gold has accumulated for 213 consecutive sessions, while the average accumulation period for XAUUSD is about 290 sessions. This is quite close. The longer the accumulation phase, the stronger the price increase afterward. However, we’ve already seen a significant rise in gold prices, meaning most of the potential gains have already been priced in.
3. What Signals Confirm That Gold Prices Will Drop Sharply?
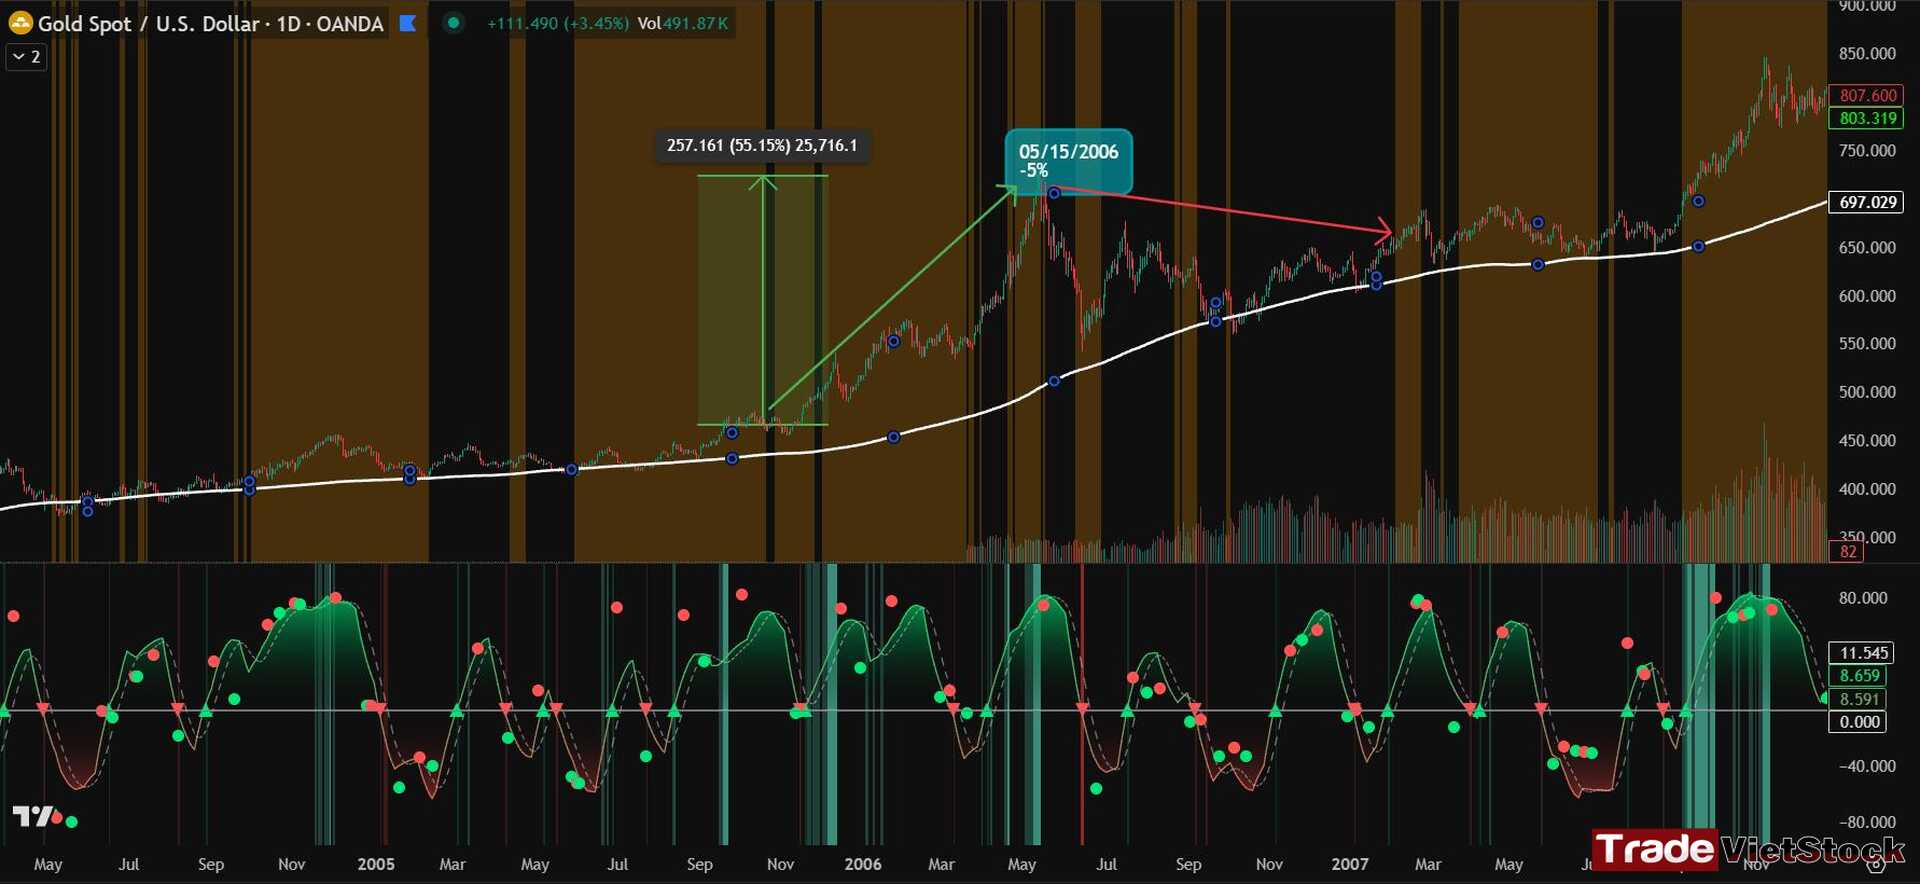
When will gold stop rising and when should we sell it? The answer is simple: we need clear confirmation signals from XAUUSD. In this case, the signal would be a sharp 5% decline in a single session. Based on statistical probability and historical data, such 5% declines have historically confirmed the start of a bear market for gold, meaning prices will either decrease or remain stagnant for an extended period.

A notable 5% drop occurred on May 15, 2006, when gold had previously surged by approximately 55% over a period of about 246 sessions. The outcome was that gold prices dropped by around 14% in the next 30 sessions.

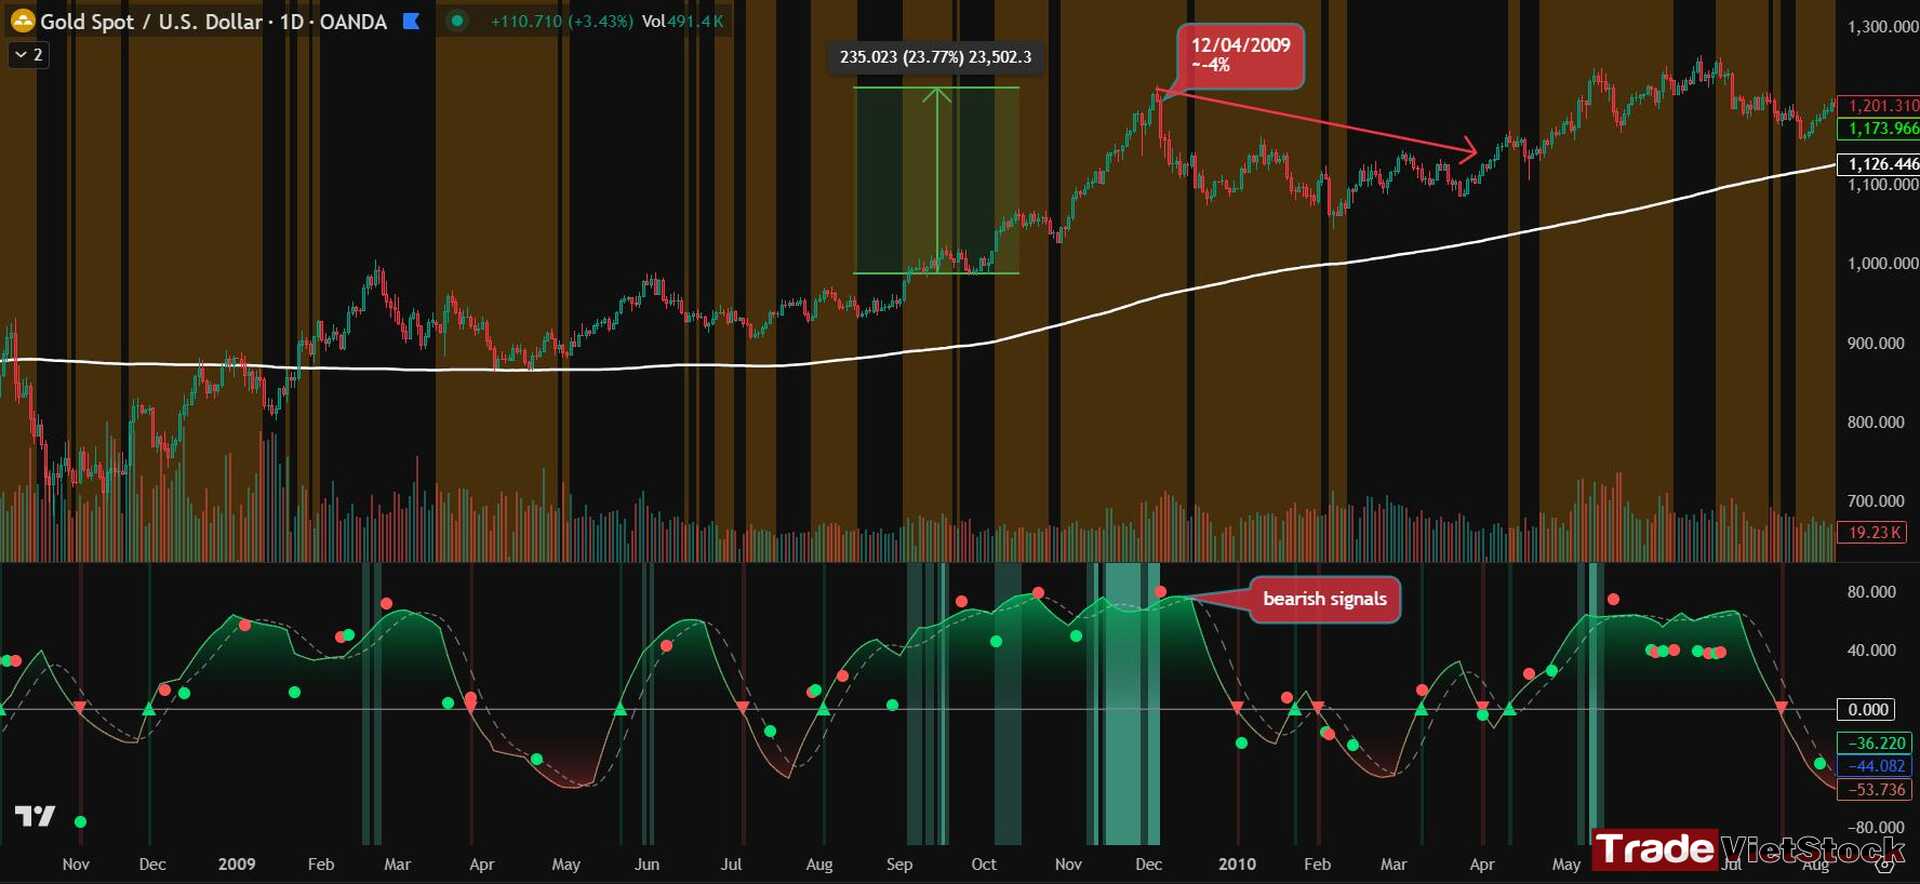
Another example of when to sell occurred on December 4, 2009, when gold experienced a 4% decline after a previous gain of 24% over 144 consecutive sessions. Since the prior gain wasn’t exceptionally strong, XAUUSD only dropped around 6% in the following 50 sessions.

From these examples, we can conclude that gold tends to rise sharply after an accumulation cycle of about 200 sessions or more, with subsequent price increases of 50% or higher. The stronger the previous rise, the larger the drop afterward, typically around 14-15%.
4. Data from Gold Sentiment
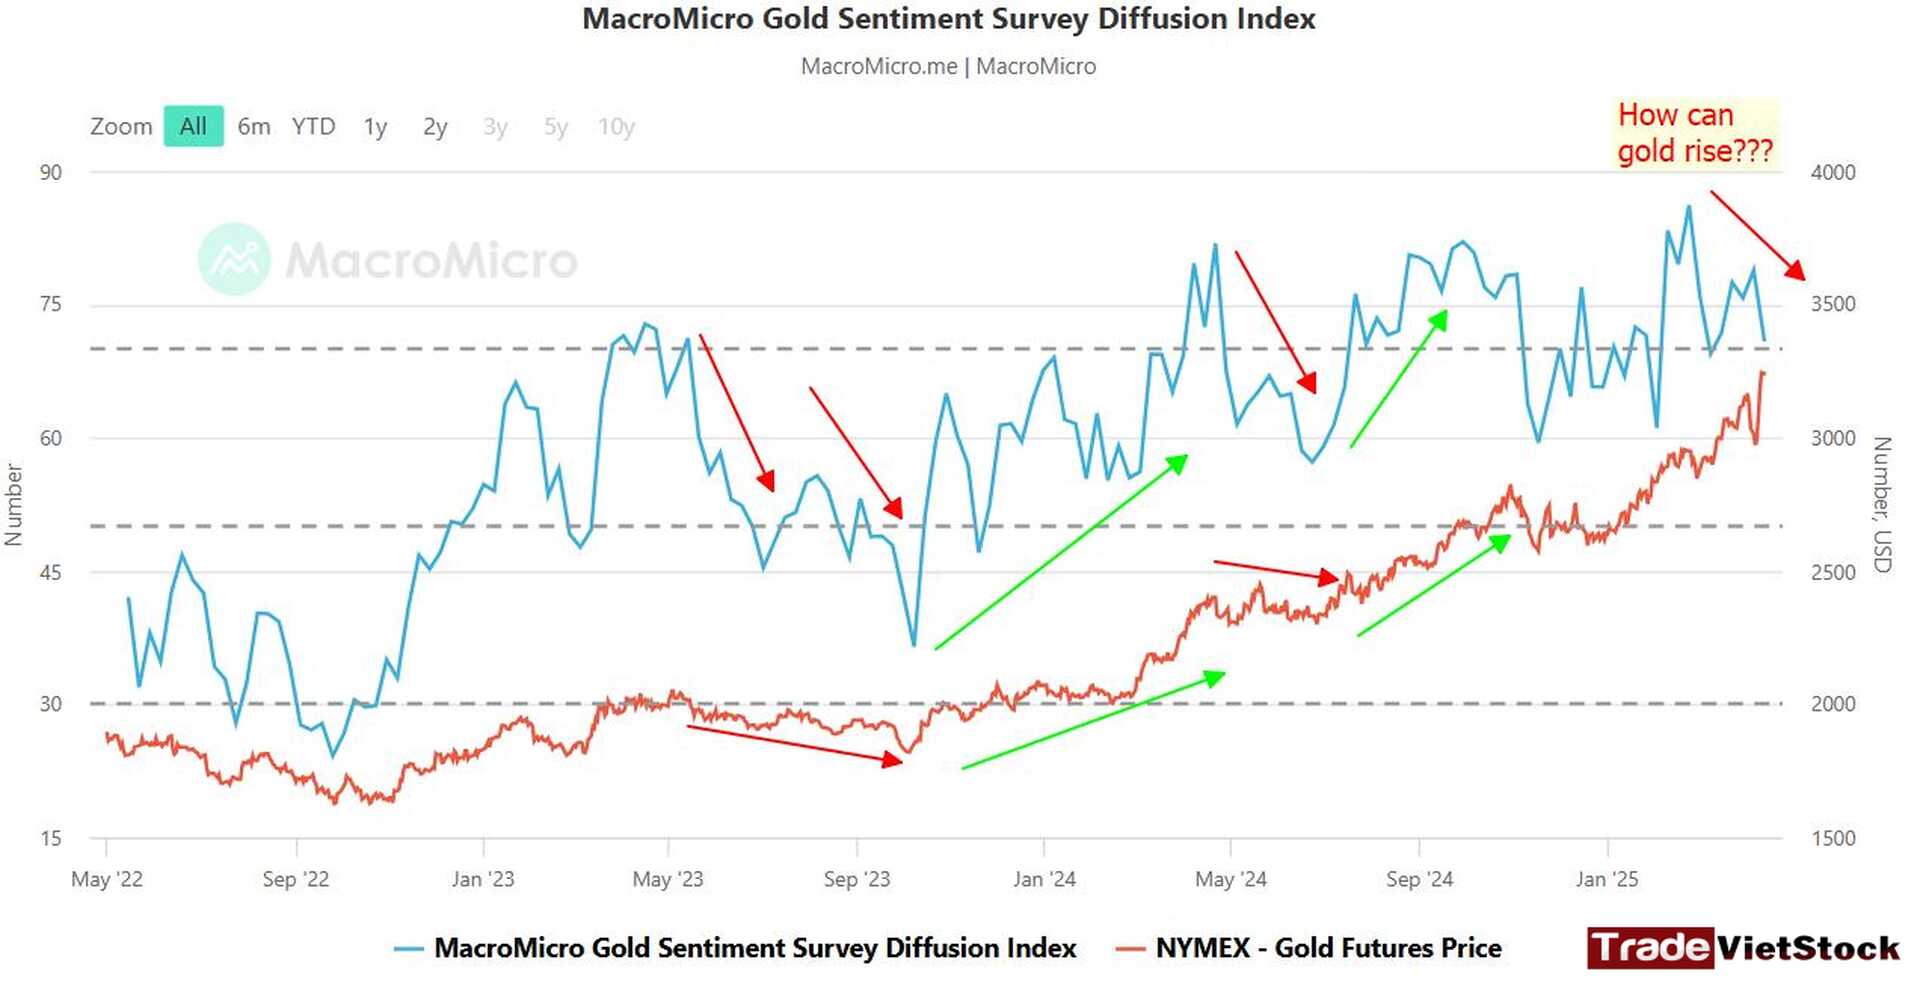
When will gold stop rising? When should you sell gold? Based on the Gold Sentiment data from MacroMicro, it’s clear that as the Survey Diffusion Index increases, gold prices tend to rise. Conversely, when this index decreases, gold prices enter a correction phase, leading to a period of stagnation.

Currently, the Survey Diffusion Index has been declining since around March 2025. So when will gold stop rising? This suggests that the gold price may soon reach the end of its upward cycle. However, since this is a lagging indicator, selling or locking in profits requires considering additional factors.
iii. Conclusion
So, when will gold stop rising and when should you sell it? Will the price reach 6,000USD per ounce? According to our analysis, the right time to sell or lock in profits is when a 5% drop occurs in a single session. This conclusion is based on data, not speculation. Gold prices are unlikely to hit 6,000USD per ounce in the near future and will likely need to go through another cycle with an average accumulation period of 200 sessions. The price target to take profit could be around 3,600USD
| Section | Details |
| History | – Gold often experiences sharp increases during financial crises, geopolitical tensions, and when the USD weakens.
– Notable historical events include: Black Monday (1987), the financial crisis (2008), and debt crises (2011, 2025). |
| Data | – Gold prices have surged in previous cycles, but after significant price increases, there is typically a sharp decline.
– Gold Sentiment: This indicator shows that when the Survey Diffusion Index decreases, gold prices may enter a correction phase. – Probability data suggests that after strong price increases (3% per session) over extended periods, gold tends to experience significant declines, usually around 14% to 15%. |
| Data Conclusion | – Gold prices have risen sharply in recent years. The conclusion is that after a strong price increase, the potential for a decline is greater (around 14-15% based on past cycles).
– After 30 consecutive sessions, following a FOMO-driven surge in gold prices, the market typically starts to decline. |
| Action | – Sell gold when signs of a correction appear, especially when gold prices increase significantly over consecutive sessions followed by a sharp decline (~5%).
– Lock in profits and consider sell positions if there is a 5% drop or indications from Gold Sentiment suggest that the gold market is entering a downtrend. – Avoid buying new gold positions when the market has been rising for too long and the Survey Diffusion Index starts to decline. |
I hope that the information in this When will gold stop rising article will help you begin your investment journey smoothly and with more confidence. Wishing everyone successful investments and profits!
We have our fan page on Facebook for Forex CFDs trading signals and analysis for every week, you can check this out: [HERE]
Furthermore, if you want real-time signals everyday, you can check out our small Investment and Trading community on Telegram: [HERE]
Don’t forget to follow this Investment and Trading Signal for free investment analysis and trading crypto and forex CFDs signals.
I know trading isn’t an easy game, especially for those who take it seriously. That’s why I believe you should practice consistently before finding the trading strategies that suit you best. You can start risk-free by opening a demo FX account to get familiar with the market.
Below are registration links for two of the best brokers:
- XTB Online Trading — the top broker for traders in the EU
- Exness — the best choice for traders in Asia
You can also experience world-class services and trusted reputations from some of the top 5 crypto exchanges:
- Binance — The largest crypto exchange on Earth
- Bybit — A well-established name known for its long-standing reputation and diverse financial instruments
- Bitget — User-friendly interface combined with a strong reputation
- MEXC — The lowest trading fees with one of the most beginner-friendly interfaces
- OKX — A major name known for secure asset storage and powerful DEX tools


 Tiếng Việt


