Top 2 Best Trading Indicators For Traders
| Date: 10/01/2025 | 841 Views | Investment and Trading Academy |
Top 2 Best Trading Indicators For Traders – An exclusive technical strategy for trading
Hello everyone! Today, Tradevietstock will introduce a highly effective Forex CFDs trading indicators that I use. You can apply these for both day trading and long-term strategies.
This set of indicators is self-coded, based on Ichimoku and Oscillator theories. You won’t find these anywhere else because they are exclusive. However, I can assist you in obtaining these Top 2 Best Trading Indicators For Traders. Details are at the end of the post.
i. Introduction to the Indicators
This is Tradevietstock‘s exclusive indicator set. I used Pinescript versions 5 and 6 to create these two indicators. The foundational theory is based on a combination of Ichimoku Cloud and Oscillator. The other indicator is a mix of HMA, SMA/EMA, and Bollinger Bands. However, I usually use HMA only.
1. Terms to Know
- Entry: The point to enter a trade
- Retest: Price rebounds at resistance/support and continues the old trend
- Scaling in: Increasing position size
- Partial profit: Taking part of the profit
- Exit: Closing the trade
2. Operational Logic
Firstly, I activate both indicators simultaneously. Each is named Tradevietstock 2nd Combo and Tradevietstock PO. The HMA line helps determine the current price phase: rising, falling, or liquidity sweeping. The other indicator helps determine entry points, scaling in, partial profit, and exit.
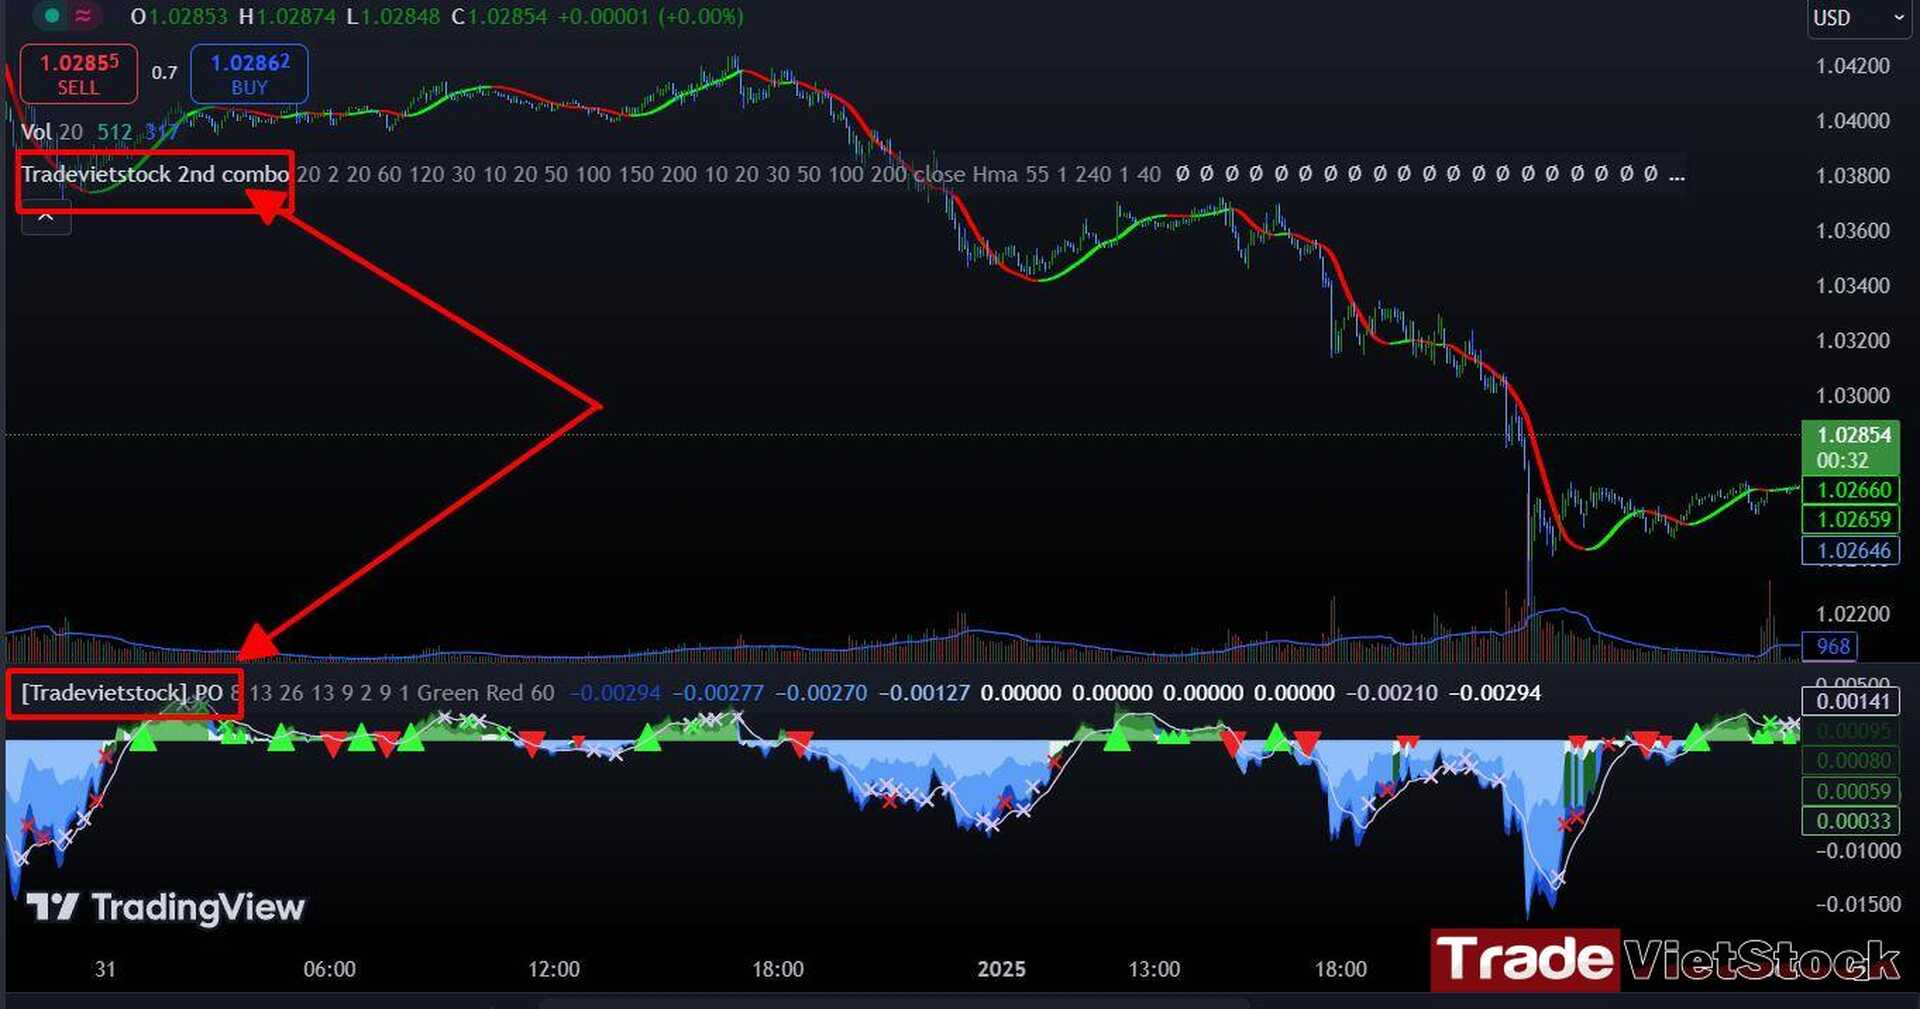
When the HMA turns red, a downward trend is likely upcoming. When it turns blue, an upward trend is probable. It’s very simple!
When the PO background turns navy/red (depending on the setting), it indicates a strong price drop. If PO turns green, it indicates a strong price rise.
ii. How to Use
1. Determining the Trend
HMA can be used to clearly identify the trend. When HMA is blue, it can act as support when prices retest and rebound.
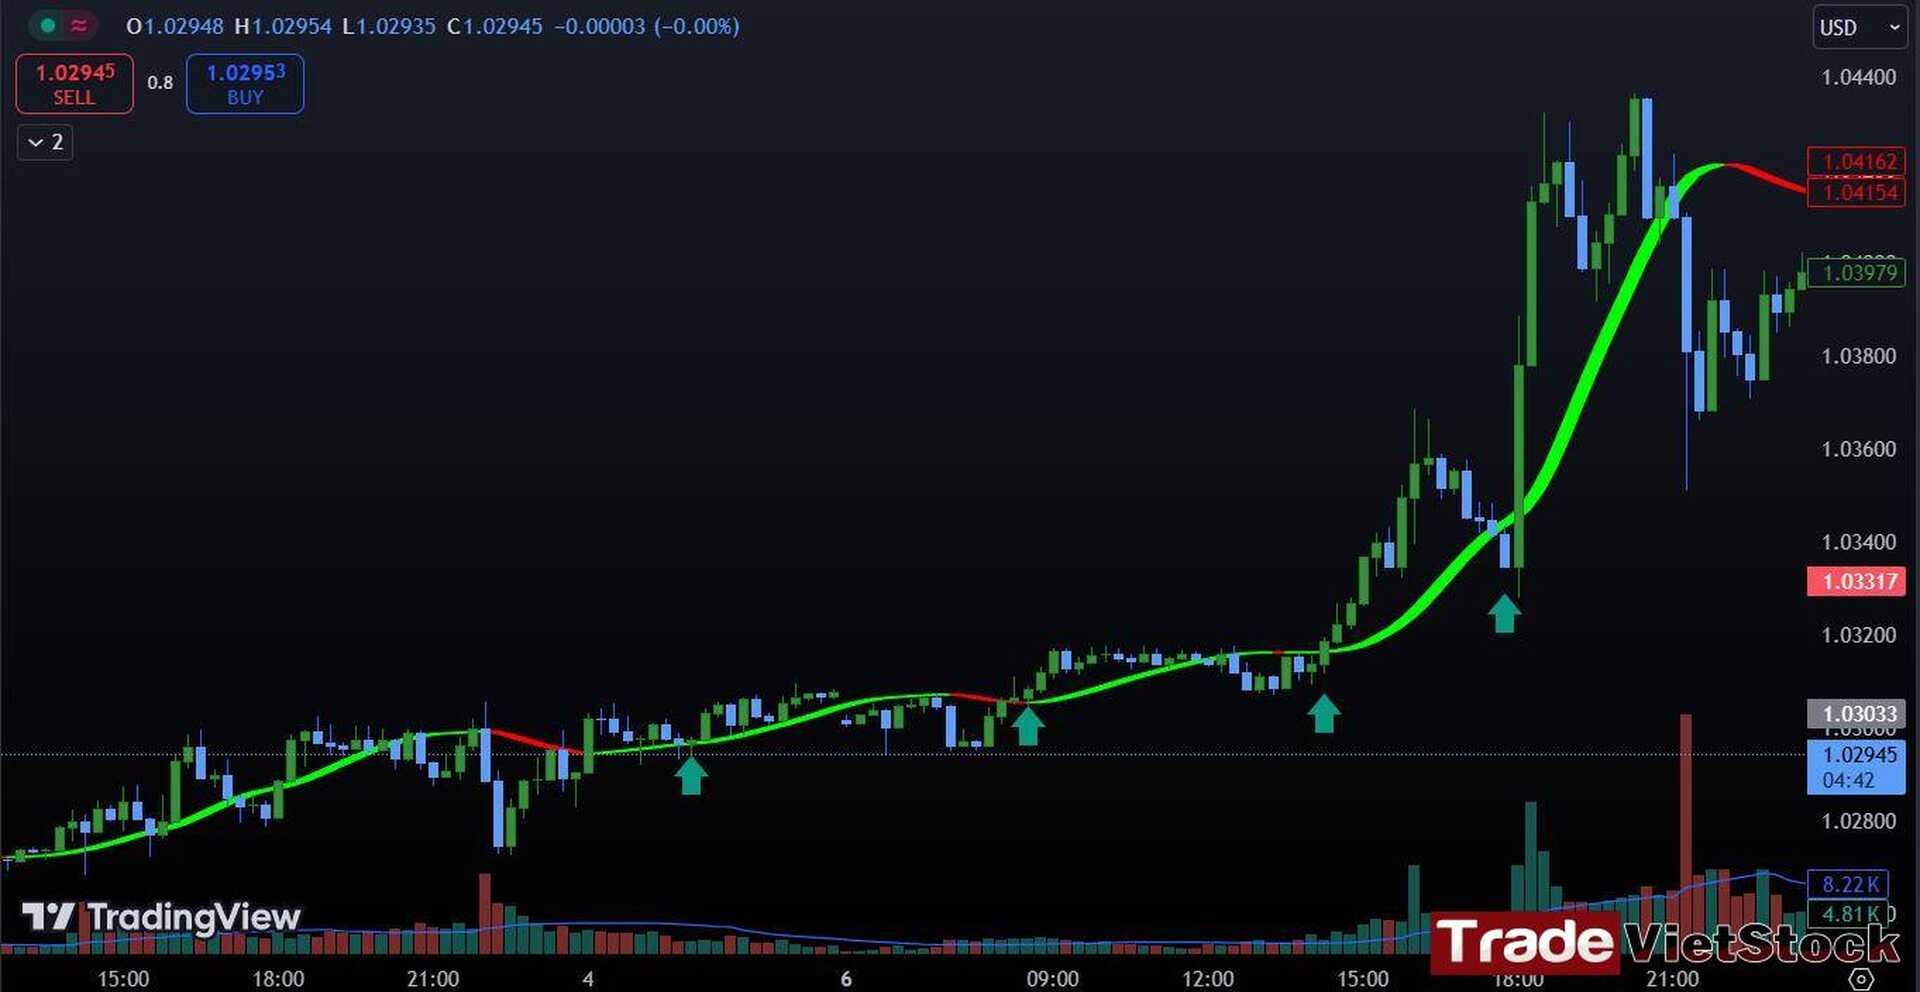
Additionally, HMA can effectively avoid noise/false signals. If the price breaks through HMA and drops, but HMA has not yet turned red, it’s very likely that the price will rebound similarly to the scenario shown above. However, further observation of price action is needed to see if the bearish candles are significant or just small retest candles.
Similarly, in the case of a clear downward trend, HMA will turn red. At this time, HMA acts as resistance when the price bounces back.
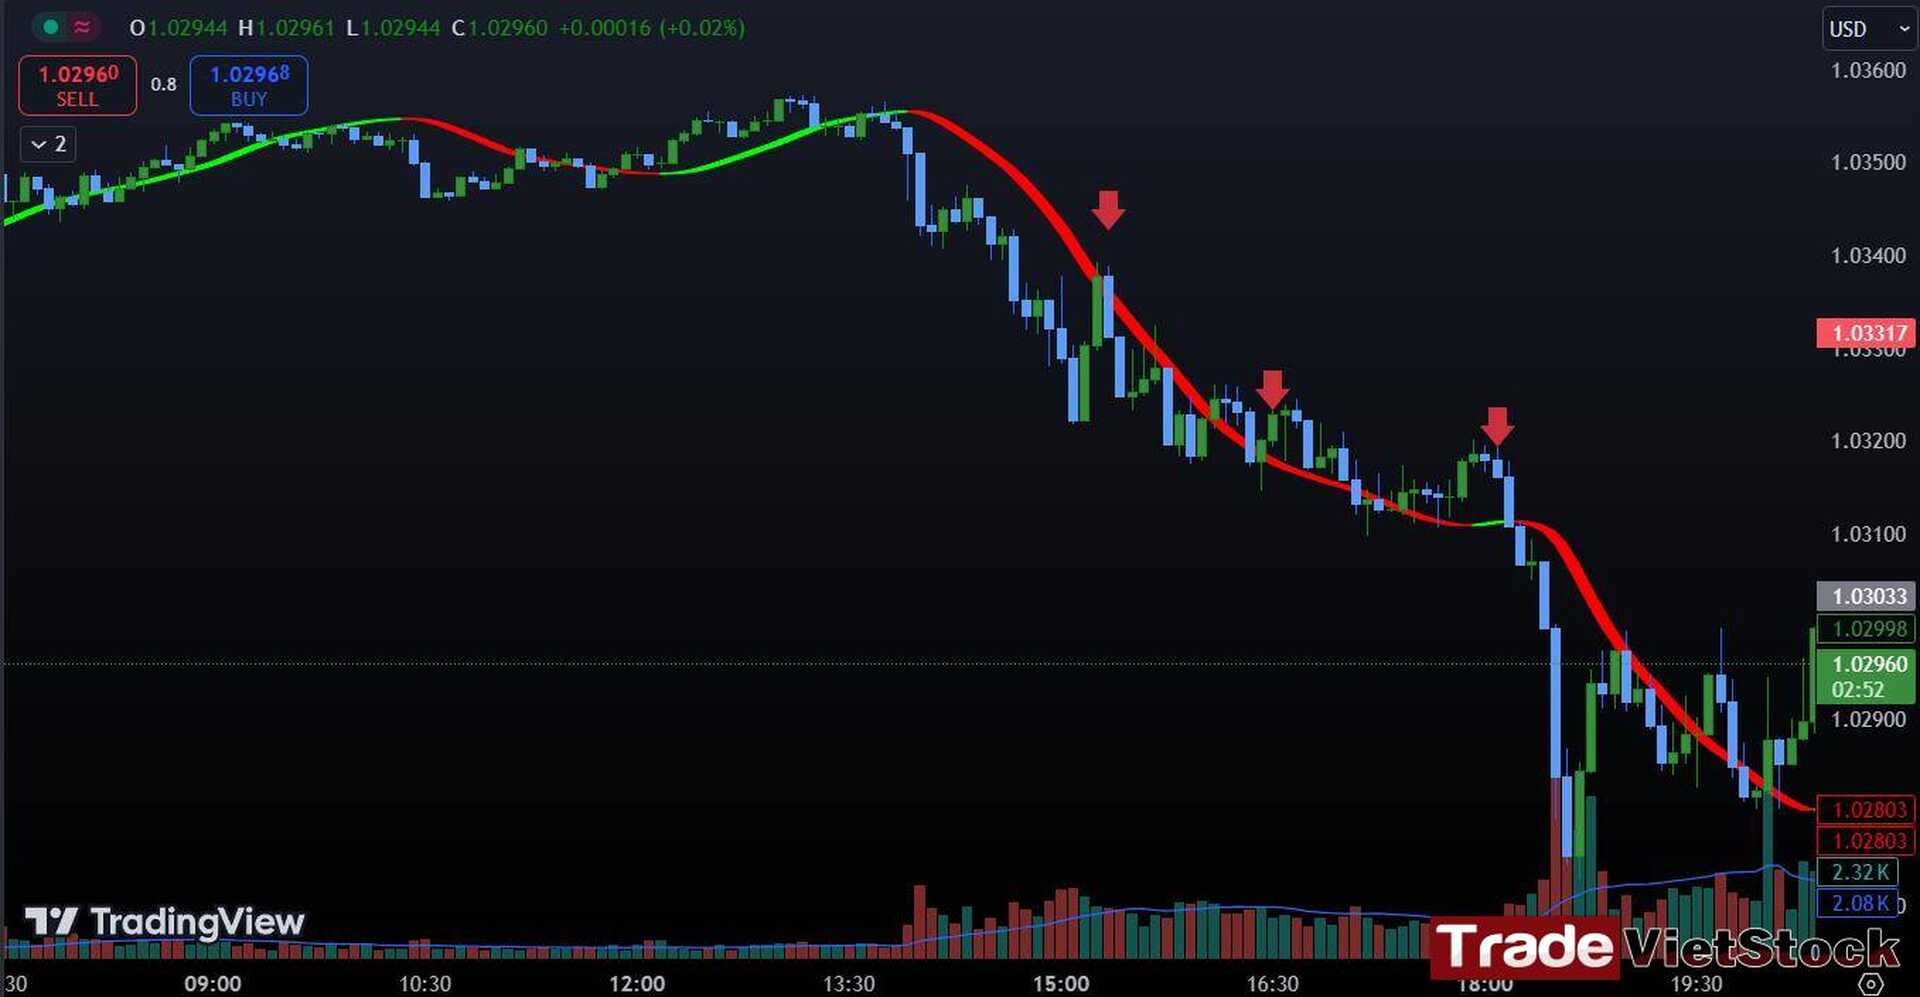
=> HMA can be a very effective compass for determining trading trends. Additionally, HMA also avoids noise/false signals very well.
2. Liquidity Sweeping
In cases where price intentionally sweeps liquidity, you will see the price cutting through HMA repeatedly and rapidly while HMA continuously changes color. This is a phase to stay away from the market.
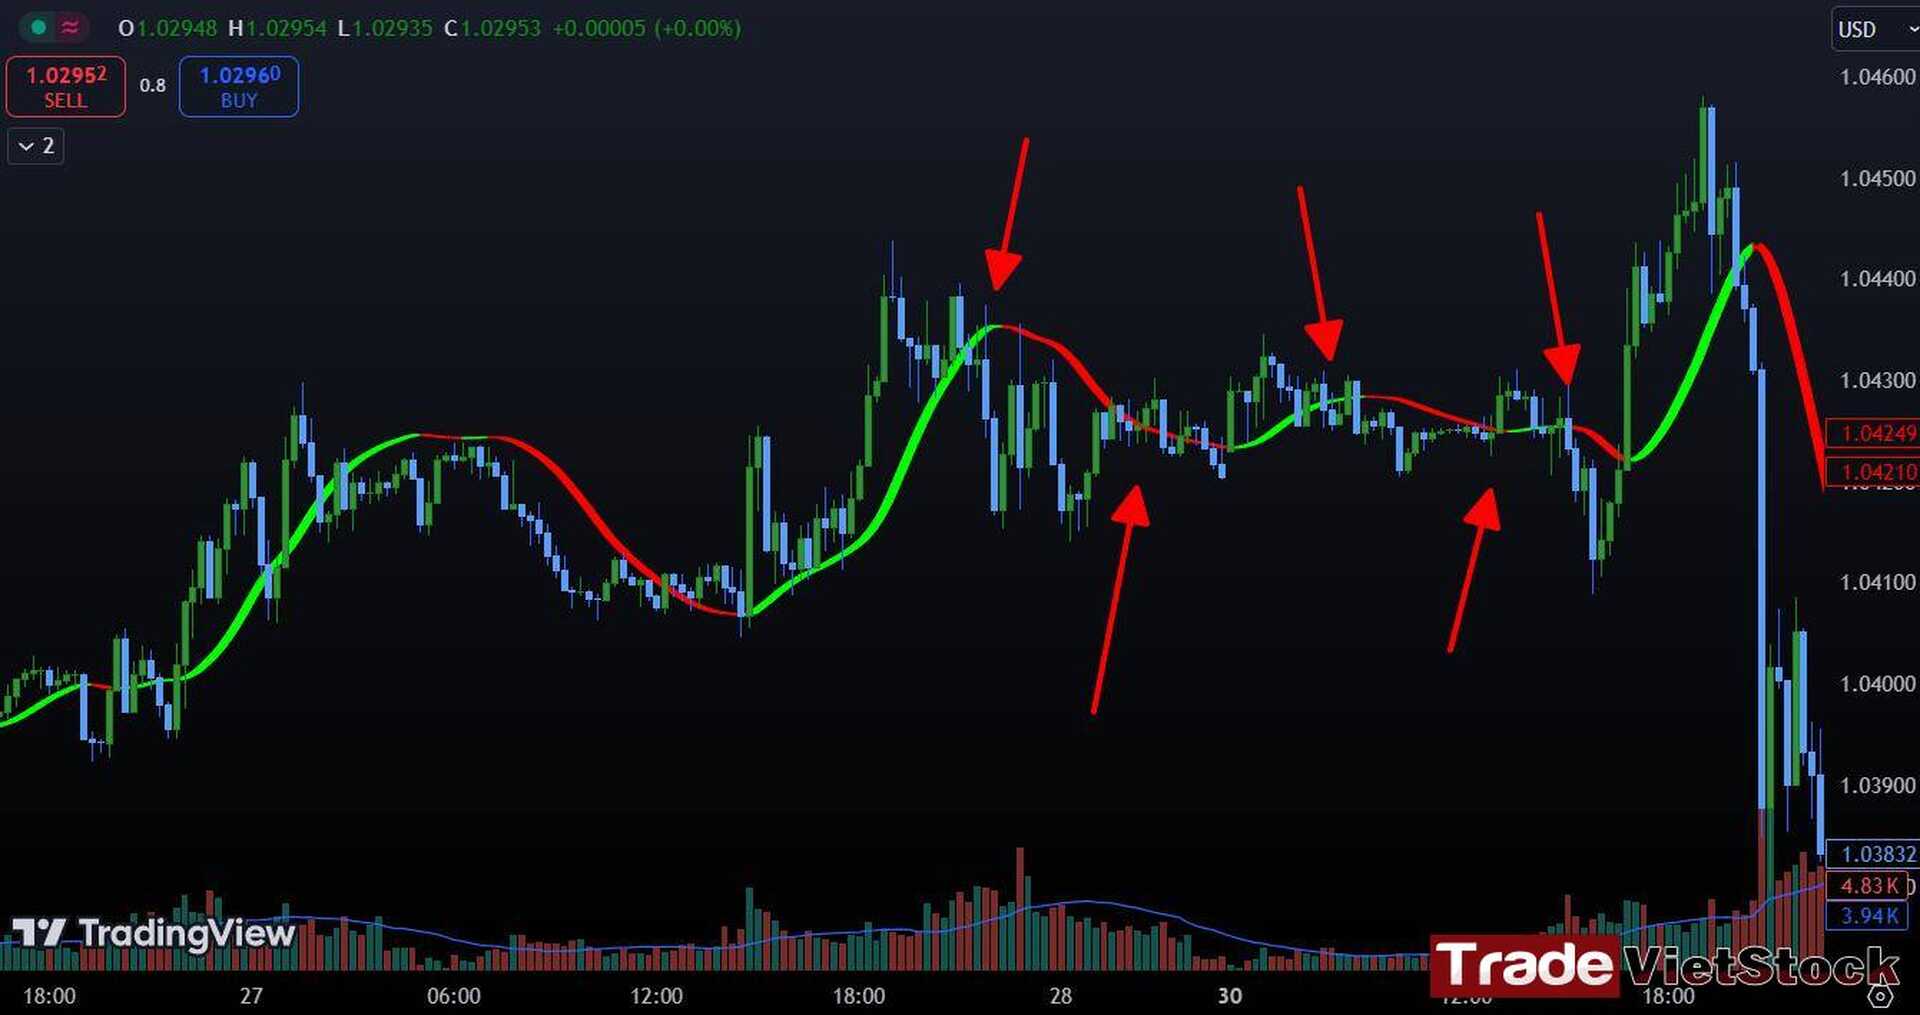
=> Traders should stay away from liquidity sweeping phases as there is no clear trend to trade. Remember, the trend is your profit.
3. Trading Signals
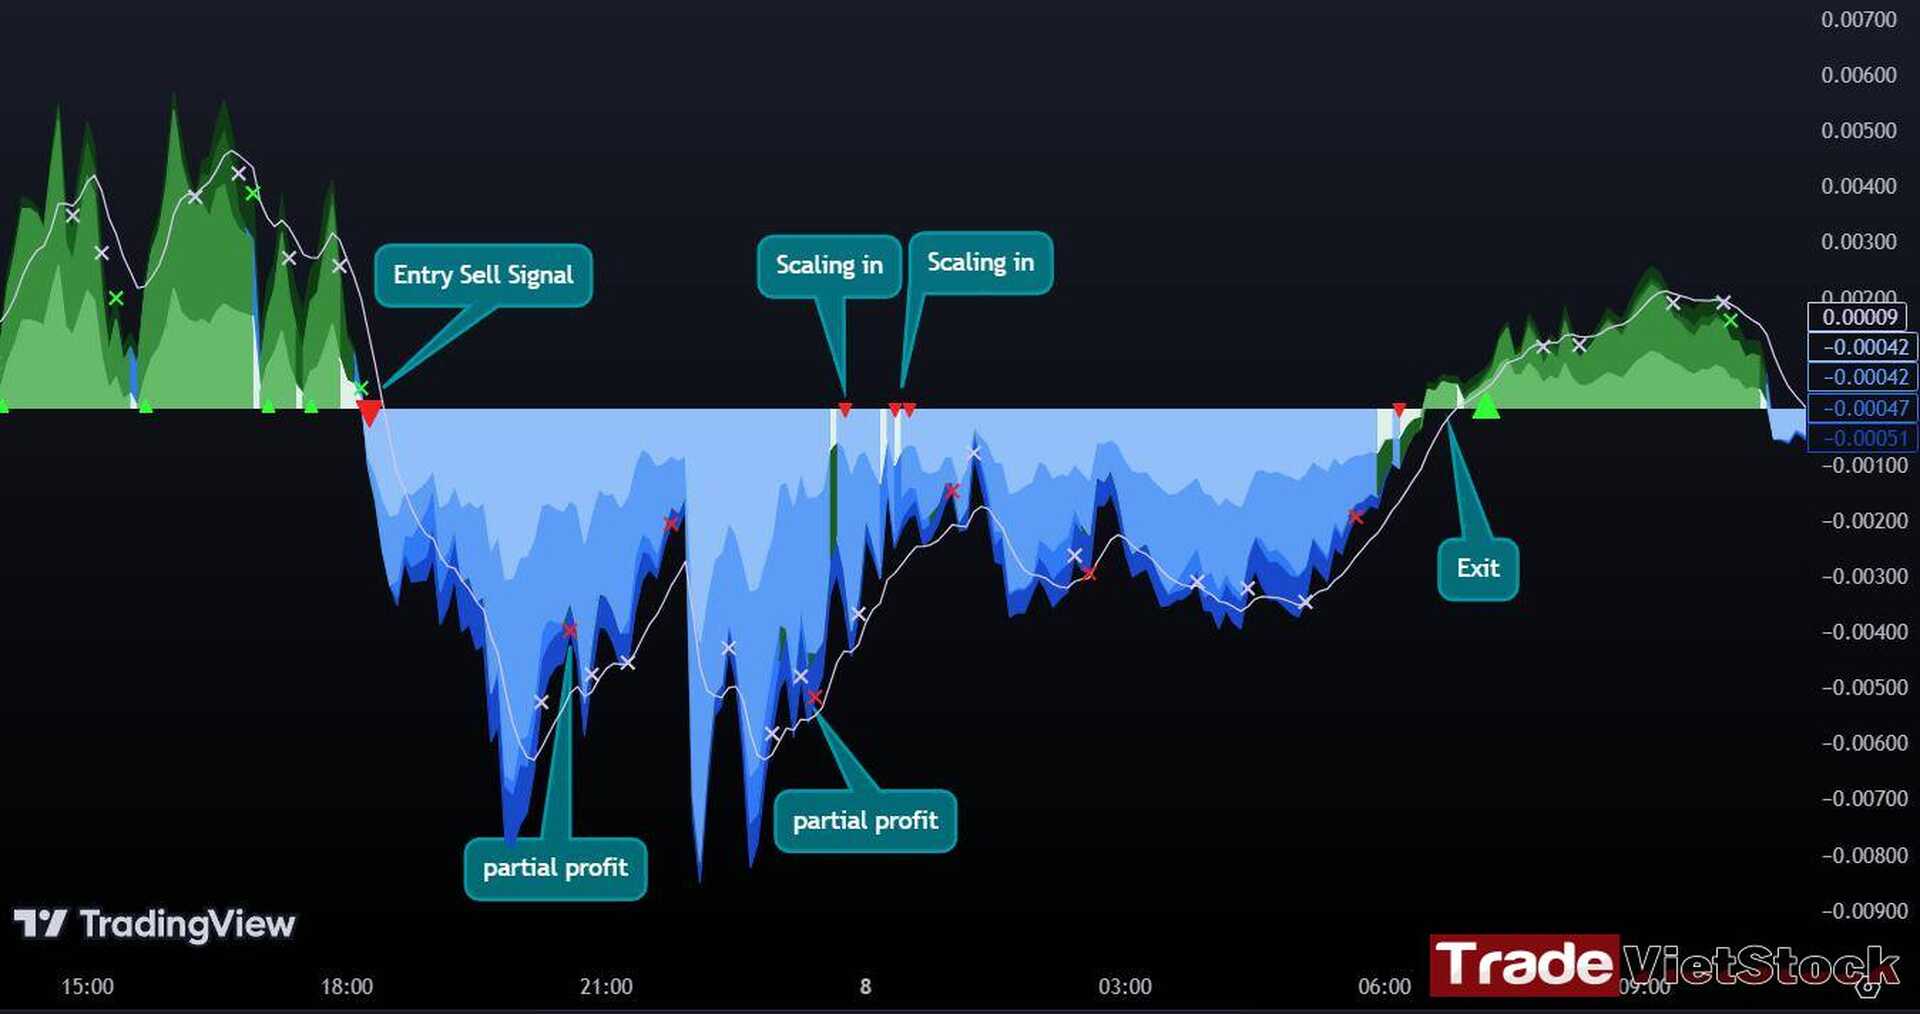
Using the Tradevietstock PO indicator, you can determine effective entry points and profit-taking. Below, the downward red arrow is the first Sell signal, smaller red arrows indicate scaling in points, and a red X marks a partial profit point, and a color shift signals when to exit the trade.
Below is a Sell signal with an R:R ratio of over 1:4.
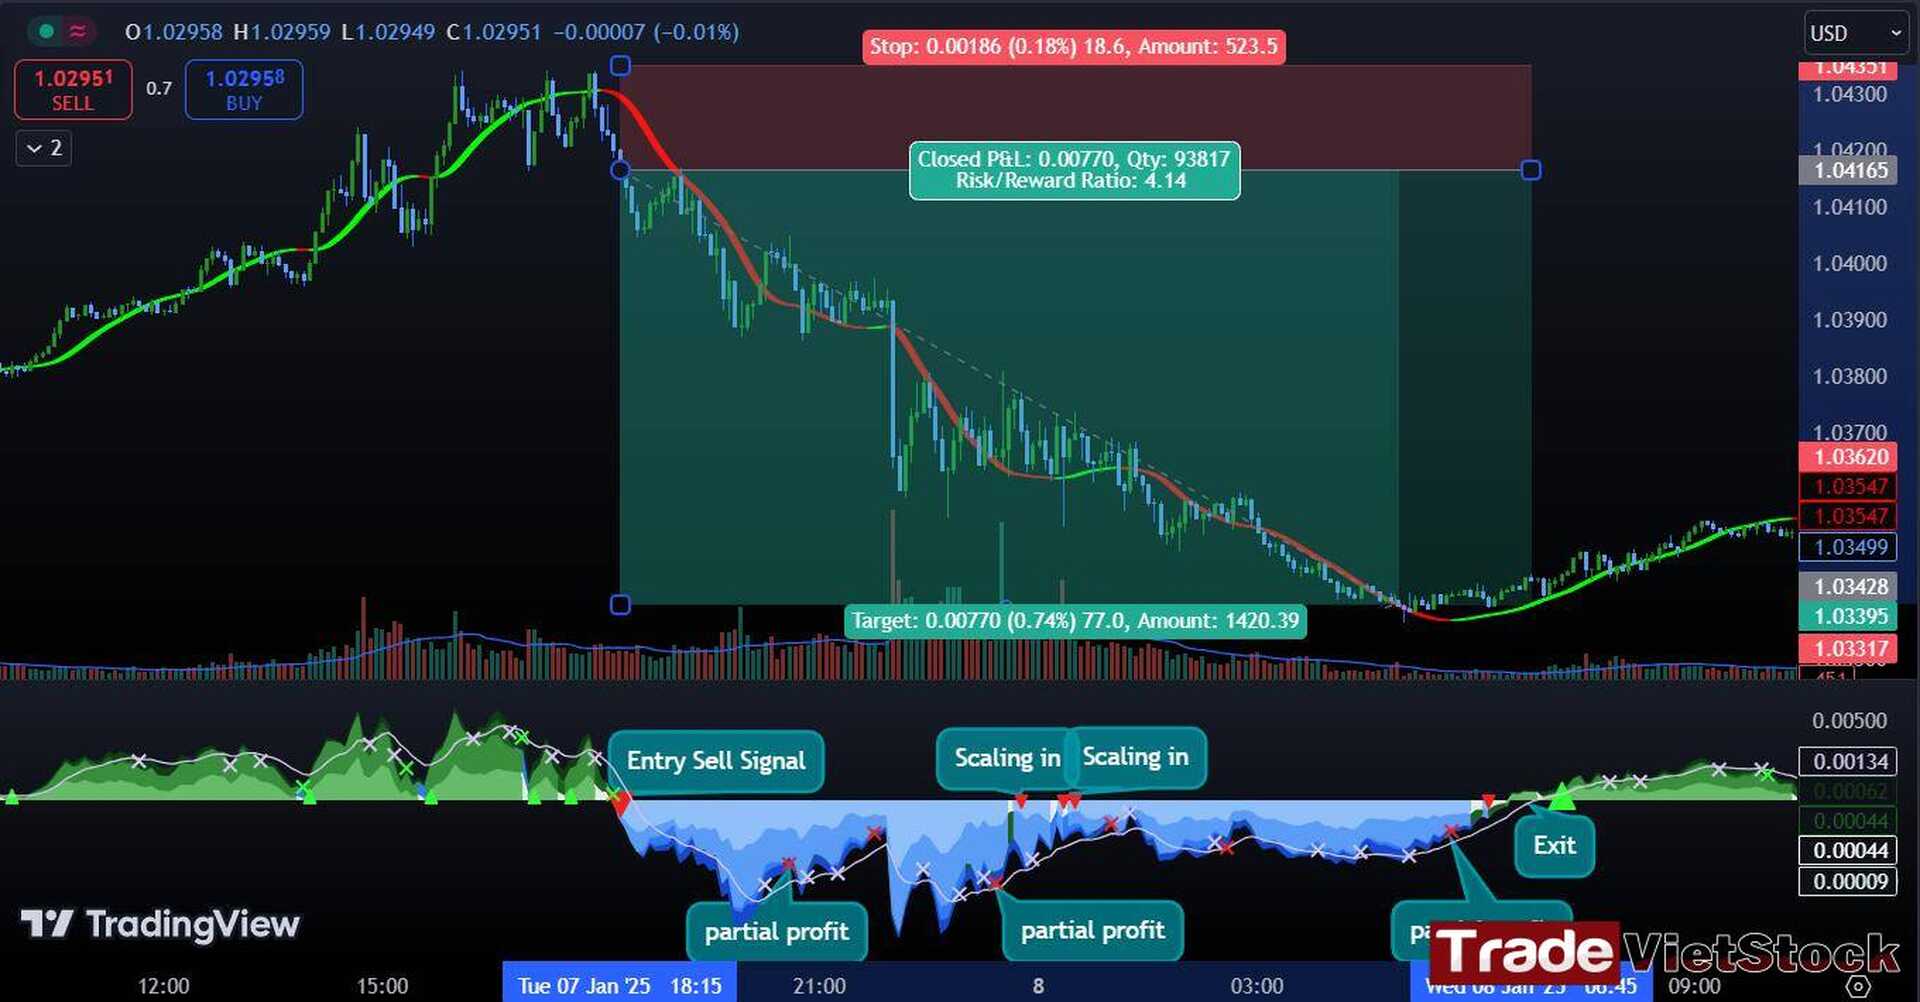
=> Using this indicator combo helps traders identify the main trend and optimal entry points.
iii. Example
With this Top 2 Best Trading Indicators For Traders, you can trade on any financial instrument or market with the same trading strategy. All you need is a optimal risk management.
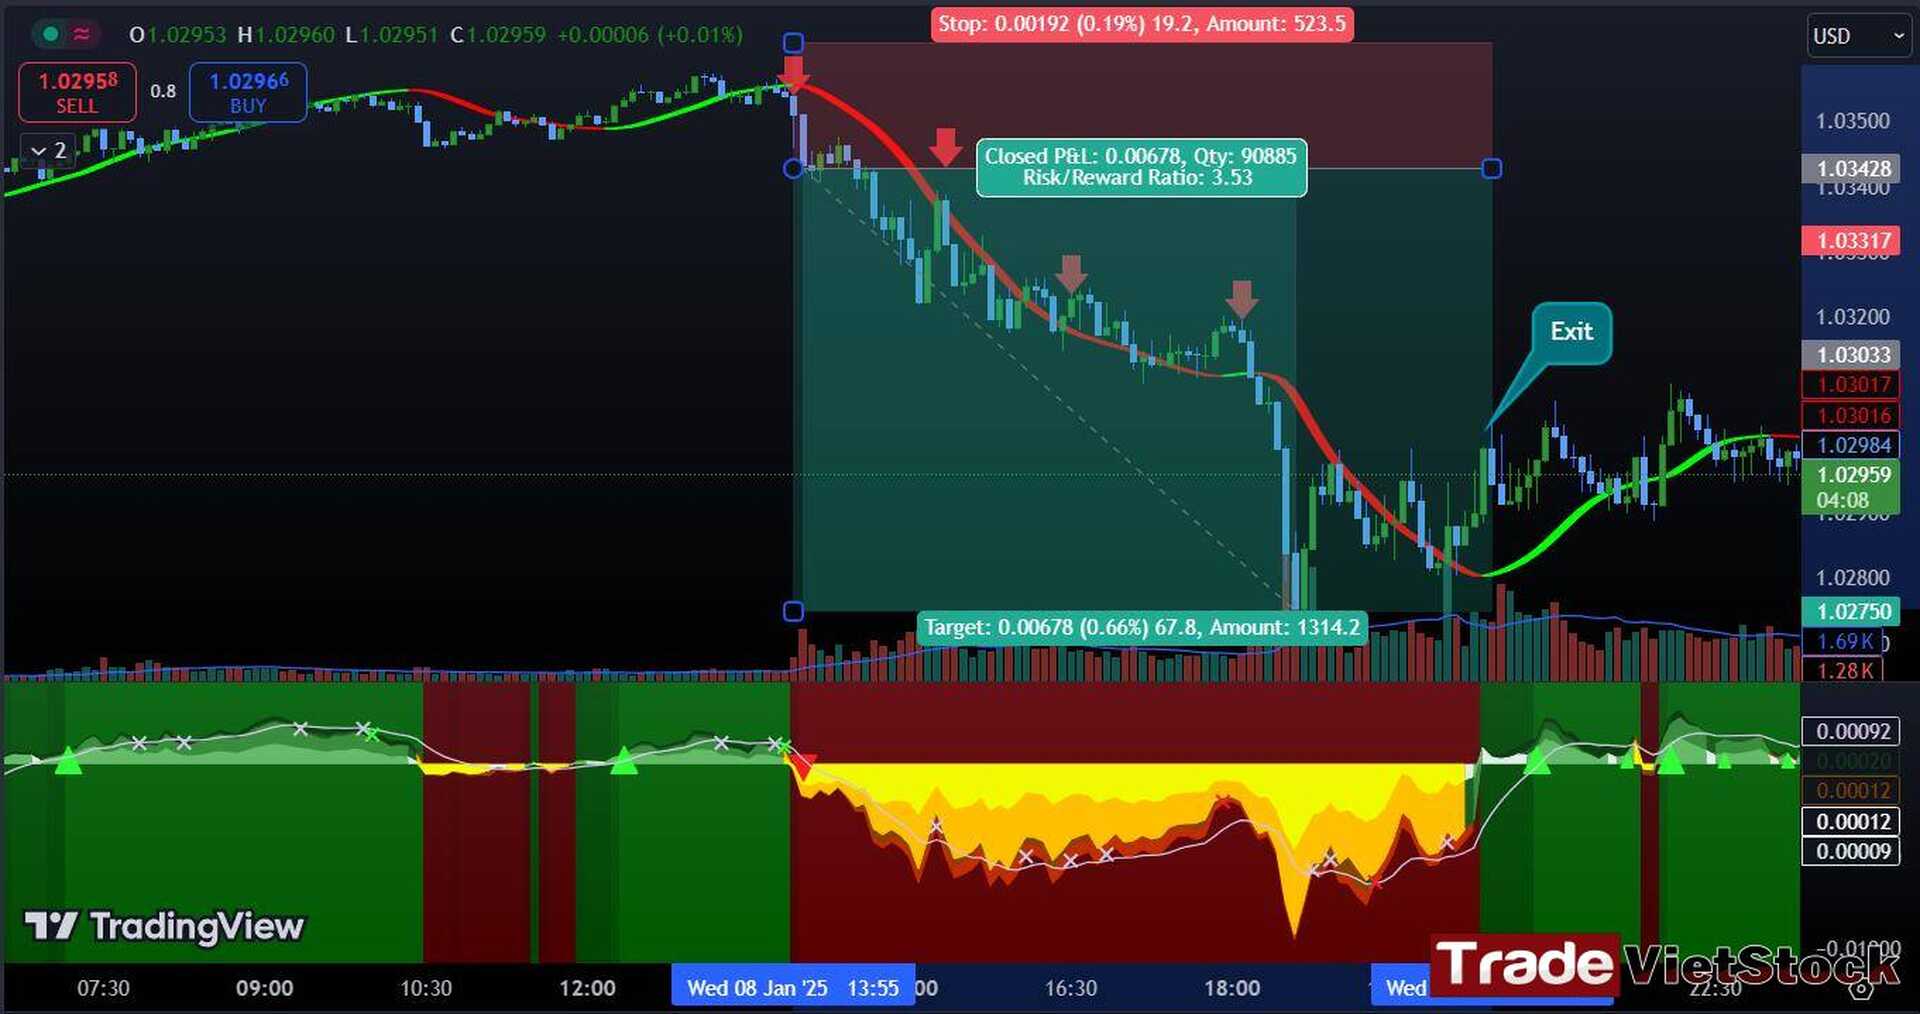
1. Trading EURUSD
Use the indicator set for Sell orders. The Exit point may be slightly delayed but ensures optimization. Throughout the price decline, you have partial profit signals to optimize profits and manage risk.
2. Trading XAUUSD
Similar to the XAUUSD trade below, the Entry point is a breakout and HMA clearly determines the trend. The Exit point remains relatively optimal with multiple partial profit points at peaks.
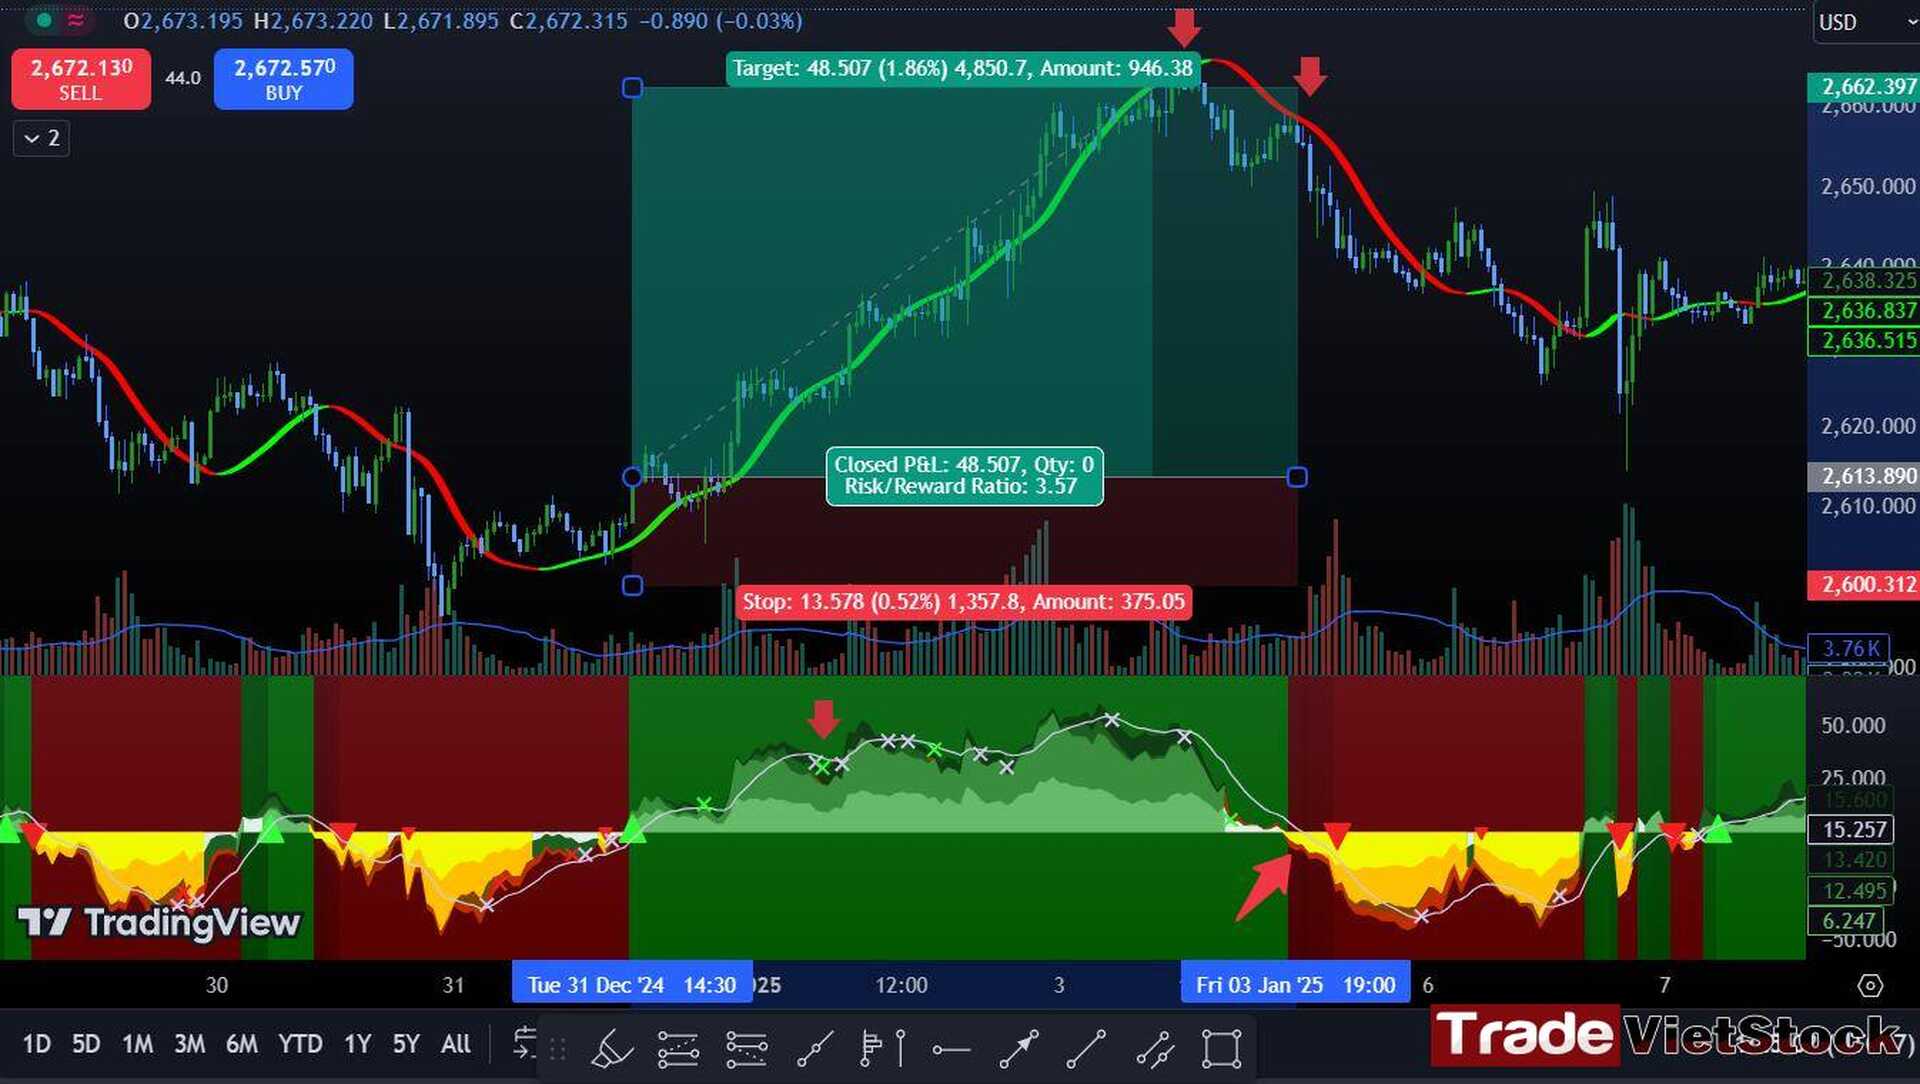
=> Combining these top 2 Best Trading Indicators For Traders with a customizable time frame can be very effective for trading with relatively good profit. However, we should pay more attention to capital management!
iv. Obtaining the Best Forex CFDs Trading Indicators
Since these are internal indicators, you won’t find them on the Tradingview community. However, if you want to use them, you can choose one of two ways:
- Open a trading account using the link below or from the left-hand menu
- Pay a fee of 19USD to receive the full source of the indicators and free setup. Contact Telegram to pay the fee and get set up.
v. Register for a trading account
If you are interested, contact us via Telegram group: HERE
Telegram: Link to discuss details and obtain the source of the Top 2 Best Trading Indicators For Traders.
I know trading isn’t an easy game, especially for those who take it seriously. That’s why I believe you should practice consistently before finding the trading strategies that suit you best. You can start risk-free by opening a demo FX account to get familiar with the market.
Below are registration links for two of the best brokers:
- XTB Online Trading — the top broker for traders in the EU
- Exness — the best choice for traders in Asia
You can also experience world-class services and trusted reputations from some of the top 5 crypto exchanges:
- Binance — The largest crypto exchange on Earth
- Bybit — A well-established name known for its long-standing reputation and diverse financial instruments
- Bitget — User-friendly interface combined with a strong reputation
- MEXC — The lowest trading fees with one of the most beginner-friendly interfaces
- OKX — A major name known for secure asset storage and powerful DEX tools


 Tiếng Việt


