The Stages of Real Estate Growth
| Date: 15/05/2025 | 1126 Views | Investment and Trading Academy |
The Stages of Real Estate Growth – The Difference in Communism and Capitalism Market
Today, at Tradevietstock, we’re diving deeper into the real estate market by analyzing the stages of real estate growth across various global markets — especially in capitalist and socialist countries. We’ll also take a closer look at the outlook for the US and Vietnam’s real estate sector. The big question is: how long will the “land is gold” mindset last? And will property prices continue to skyrocket with no end in sight?
While the main focus of this article is to break down the stages of real estate growth, I also want to shift your attention to the stock market — particularly real estate stocks. Is there a meaningful correlation here that investors can take advantage of?
I. Real Estate Markets in Socialist Countries
In socialist countries, the real estate market is centrally controlled. Land is collectively owned, and real estate projects must go through multiple layers of government approval. Prices are influenced not only by supply and demand but also by state policies, such as credit access and urban planning. However, with the adoption of economic reforms, these markets now show a hybrid model — blending elements of socialism and capitalism.
1. China
a. Key Factors Influencing Real Estate Prices
China’s real estate market is a mix of state control and market dynamics. While land remains state-owned, private developers are allowed to lease land and develop projects. Several major factors impact the stages of real estate growth:
Monetary tightening and stimulus cycles:
From 2020 to 2023, China tightened credit policies in the property sector to curb speculation, leading to a 10% drop in home prices in Shenzhen and Guangzhou. Mortgage rates rose from 4.5% in 2020 to 5.5% by 2024, contributing to a 20% decline in transactions.
However, in 2024, the government introduced a 1 trillion CNY rescue package and eased credit conditions. This stimulus led to a 5% rebound in housing prices in Beijing. Previous liquidity injections between 2015 and 2019 had fueled a 50% price surge, especially in cities like Shanghai.
Birth rate and population trends:
China’s birth rate dropped to a historic low of 0.8 children per woman in 2023, and the population declined from 1.41 billion in 2020 to a projected 1.40 billion in 2025. This demographic shift is expected to reduce long-term housing demand, especially in lower-tier cities, where home prices fell by 15% between 2020 and 2025.
In contrast, Beijing and Shanghai continue to attract internal migration — with about 2 million new residents annually — sustaining demand for high-end apartments.
China’s urbanization rate stands at 66.2%, indicating there is still room for future growth in urban housing demand.
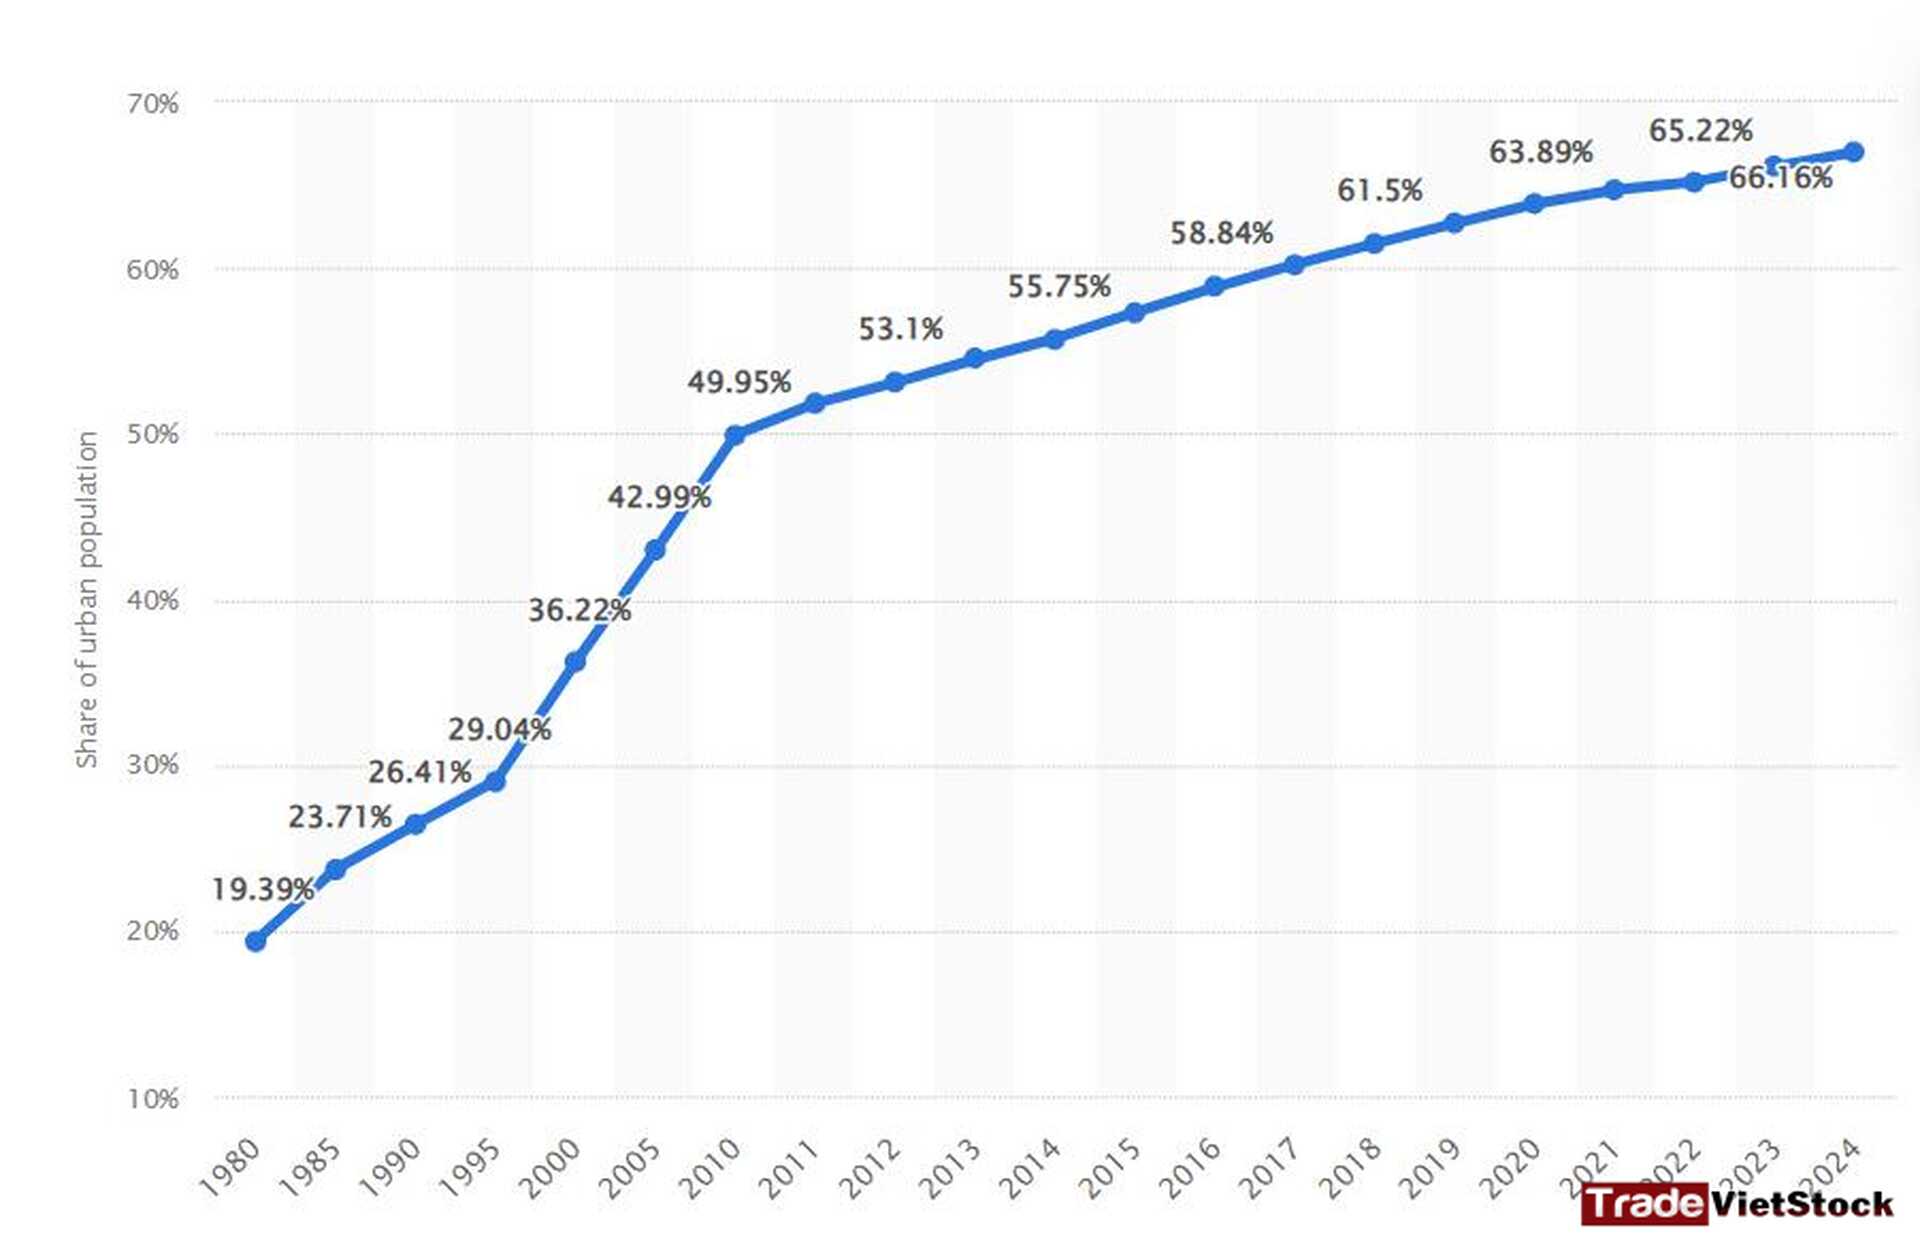
Real Estate Prices in Select Regions:
- Beijing and Shanghai: Demand remains strong thanks to concentrated economic activity (accounting for 25% of GDP), foreign investment, and major infrastructure projects like Daxing Airport. In 2024, average apartment prices reached around $10,000 per square meter, up 7% due to government rescue policies (source: web:15).
- Hangzhou: Fueled by its thriving tech scene (home to Alibaba), home prices rose 8% in 2024.
- Tier-3 cities (e.g., Hebi): Prices dropped by 20% due to oversupply—millions of vacant units—and developer debt, notably from firms like Evergrande. Industrial air pollution (PM2.5) in these areas also contributed to a further 0.5% decline in prices.
The growth outlook for China’s property market is increasingly uncertain, largely due to a record-low birth rate—now below the replacement level of 1. In this context, natural supply-demand dynamics and fiscal policy support will likely continue to underpin property prices in densely populated cities like Beijing, Shanghai, and Hangzhou. However, the room for further price appreciation in these major cities is becoming limited.
In contrast, tier-3 cities face steeper challenges. A lack of strategic development planning combined with insufficient real demand has made it difficult to absorb existing housing stock. As a result, the market potential in these regions remains weak and unlikely to meet growth expectations.
=> Given these factors, it appears that China’s real estate market will face significant long-term headwinds. Even with fiscal stimulus in play, low natural demand and a historically low birth rate are likely to constrain sustainable growth.
b. Chinese Real Estate Stocks
Housing prices in China have generally been in decline since 2022, despite ongoing monetary easing and supportive fiscal policies.
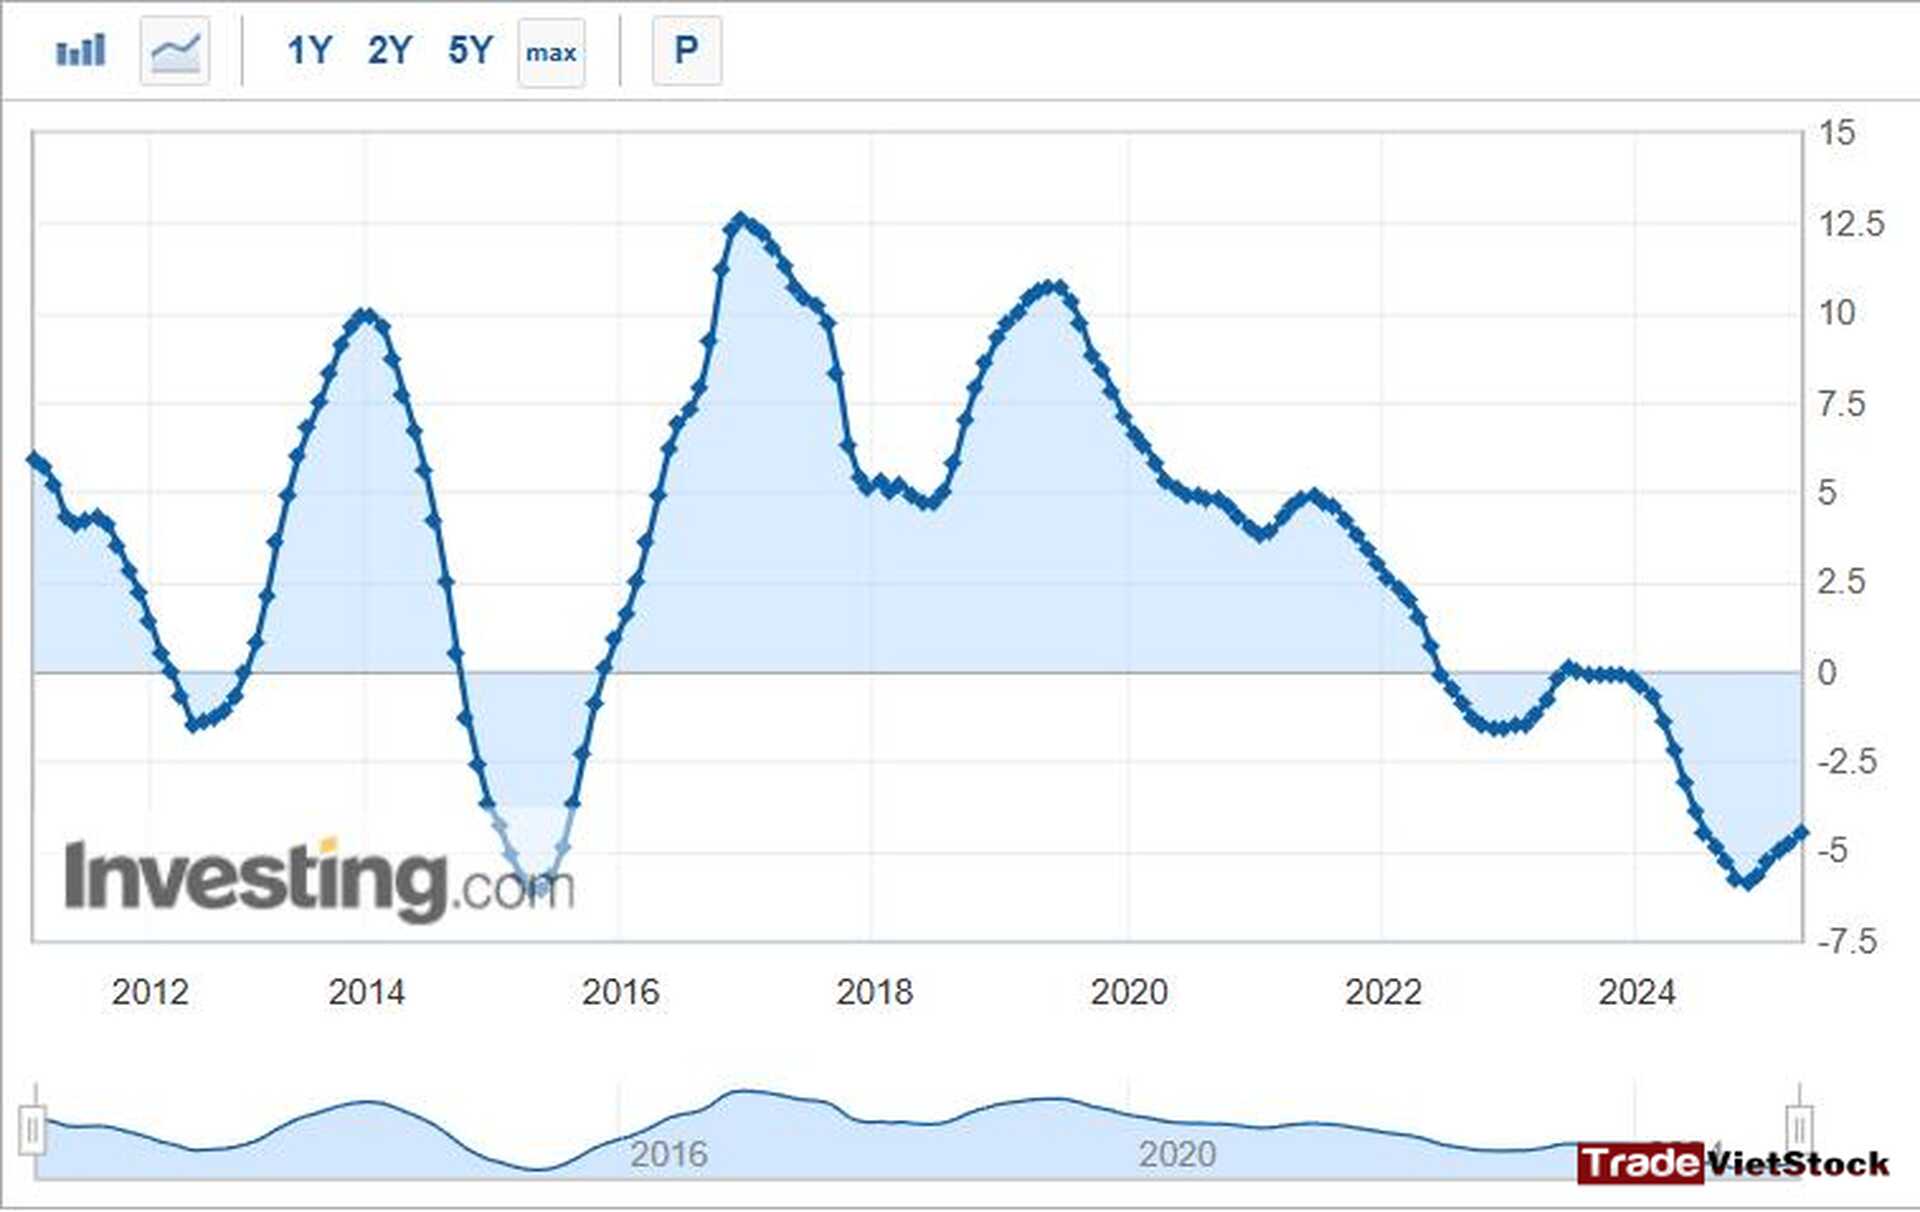
The performance of Chinese real estate stocks is not only influenced by fiscal policy but also closely tied to the trajectory of property prices, as reflected in the House Price Index. In practice, even during periods of monetary easing, if property prices fail to show meaningful growth, real estate stocks tend to struggle to gain momentum.
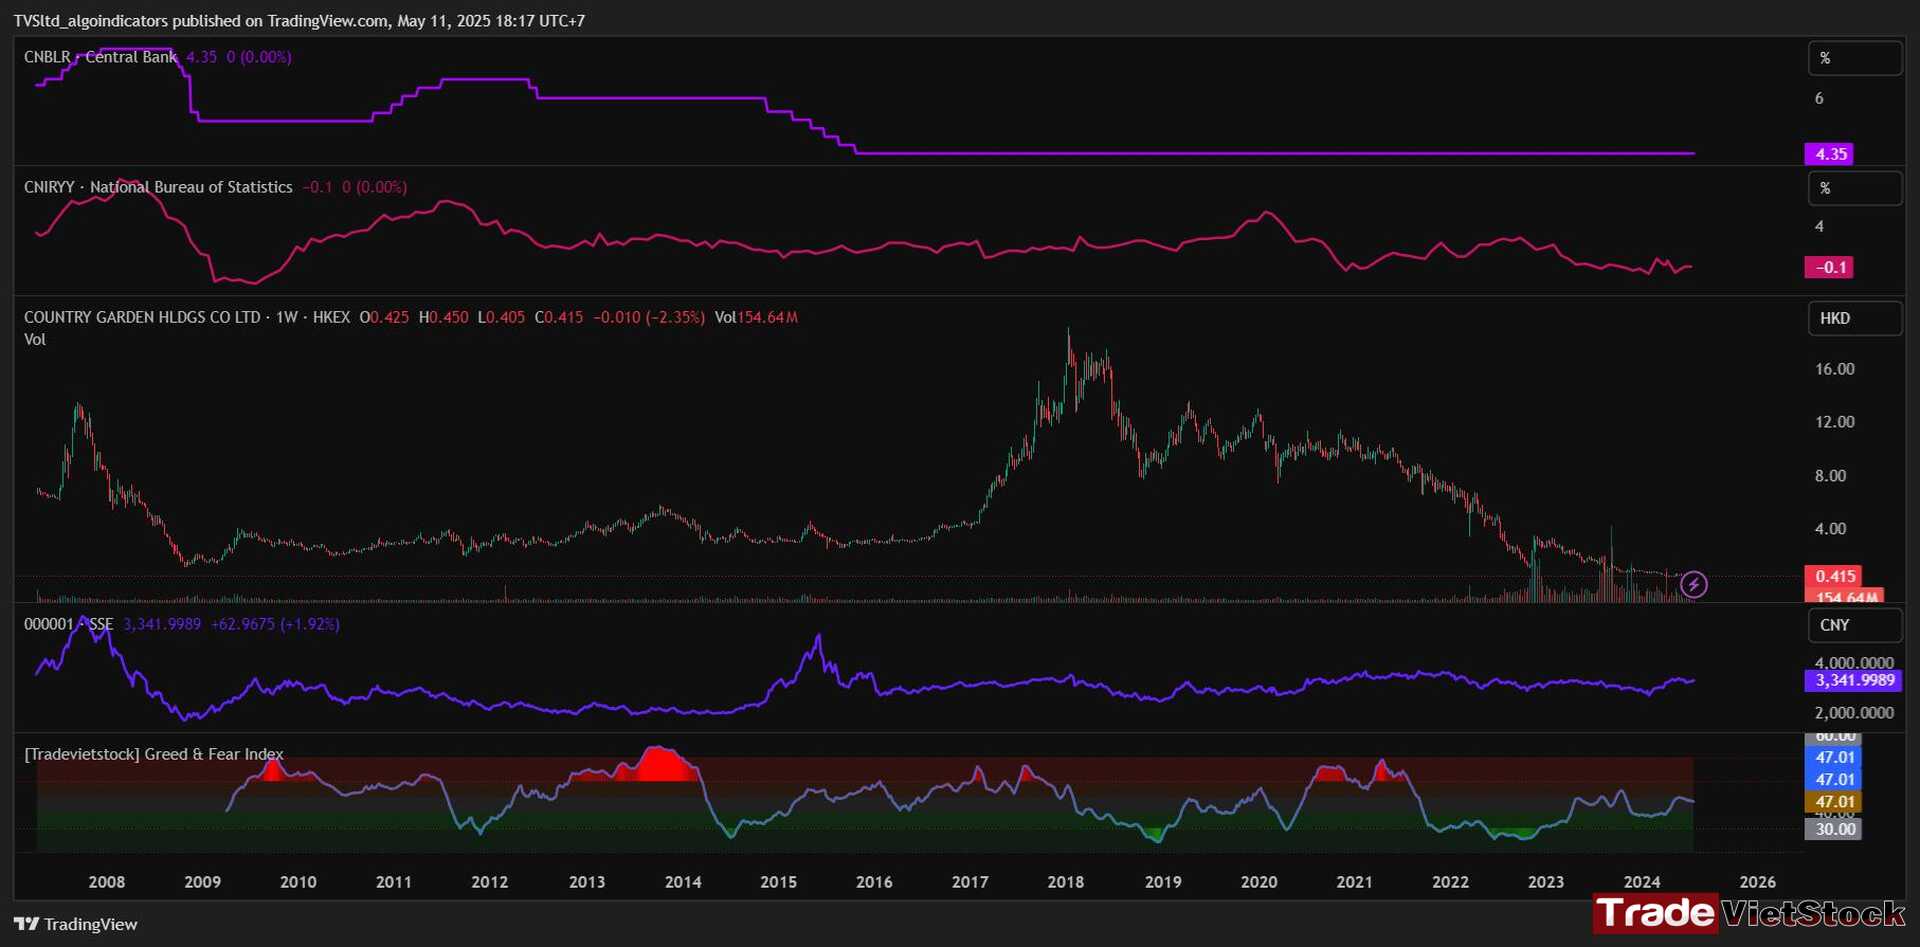
The current environment is a clear example: although China is actively implementing monetary easing, housing prices remain in negative growth territory. This has kept real estate stocks subdued, with little sign of recovery or upward momentum.
2. Vietnam
a. Key Factors Influencing Real Estate Prices
Vietnam’s real estate market operates under centralized control—land is collectively owned by the people, managed by the state—but since the Đổi Mới economic reforms in 1986, supply and demand have become increasingly dynamic. Between 2019 and 2024, housing prices in Hanoi and Ho Chi Minh City rose by 35%. The government regulates the market through credit policy, urban planning, and the 2024 Land Law. Key factors influencing real estate prices include:
Monetary Tightening and Stimulus Cycles:
From 2022 to 2023, the State Bank of Vietnam tightened credit, with lending rates around 12%, causing transaction volume to drop by 40%. In 2024, credit easing and a 350 trillion VND stimulus package fueled a sharp rebound. Apartment prices in Hanoi rose 77.6% compared to 2019, reaching 70.2 million VND/m². In Ho Chi Minh City, prices climbed to 71.8 million VND/m², a 35% increase over the same period. A previous stimulus phase (2007–2008) had similarly triggered a 70% surge in property prices.
Birth Rate and Demographics
Although the birth rate fell to 1.91 children per woman in 2024, population growth continues due to urbanization—38% of the population now lives in cities, increasing by 1% annually. Hanoi and Ho Chi Minh City attract over one million internal migrants each year, boosting housing demand. In contrast, rural and mountainous provinces such as Hà Giang have lower housing demand, with land prices rising just 5% between 2020 and 2025.
Real Estate Prices by Region:
- Hanoi: Prices surged 77.6% thanks to infrastructure and urban planning projects like Ring Road 4 and the metro lines. In 2024, high-end apartments in Tây Hồ reached up to 100 million VND/m².
- Ho Chi Minh City (Thu Duc): Prices rose by 10% in 2024, driven by development plans for the creative city district and strong FDI inflows.
- Mountainous provinces: Prices have either declined or remained flat due to underdeveloped infrastructure and outmigration to cities. In industrial areas like Bắc Giang, land prices fell 0.3% due to pollution.
b. Real Estate Stock Performance
Currently, Vietnam’s national housing price growth index is hovering around –5%. Previously, in October 2020, the index had bottomed out at –10%, marking a historical price floor for the entire property market and real estate stocks. It’s important to note that this index reflects the nationwide average and doesn’t capture regional disparities.
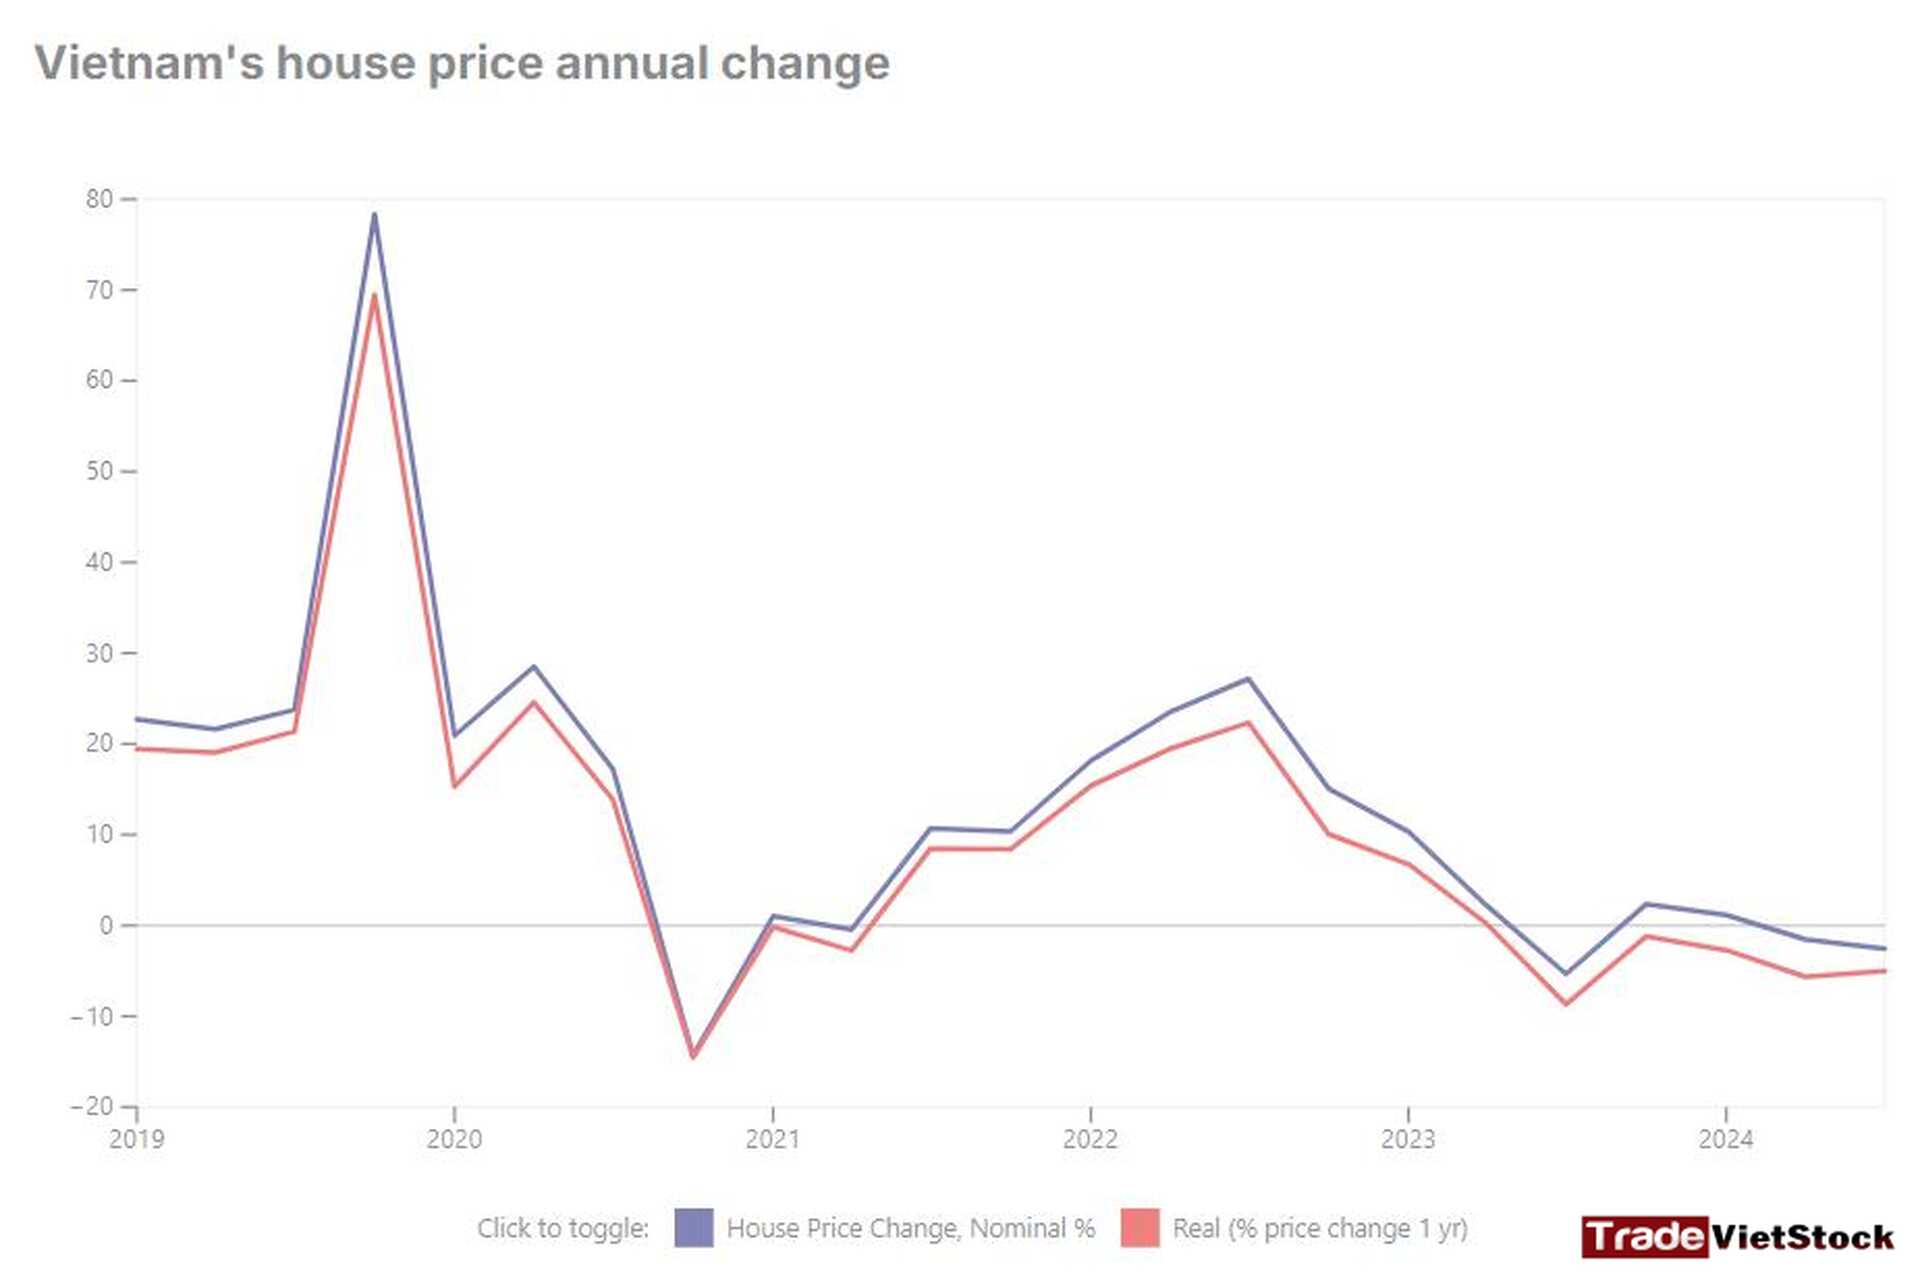
Vietnam’s real estate growth phases have closely mirrored monetary easing cycles. Notably, real estate stocks tend to move in strong correlation with the Housing Price Index.
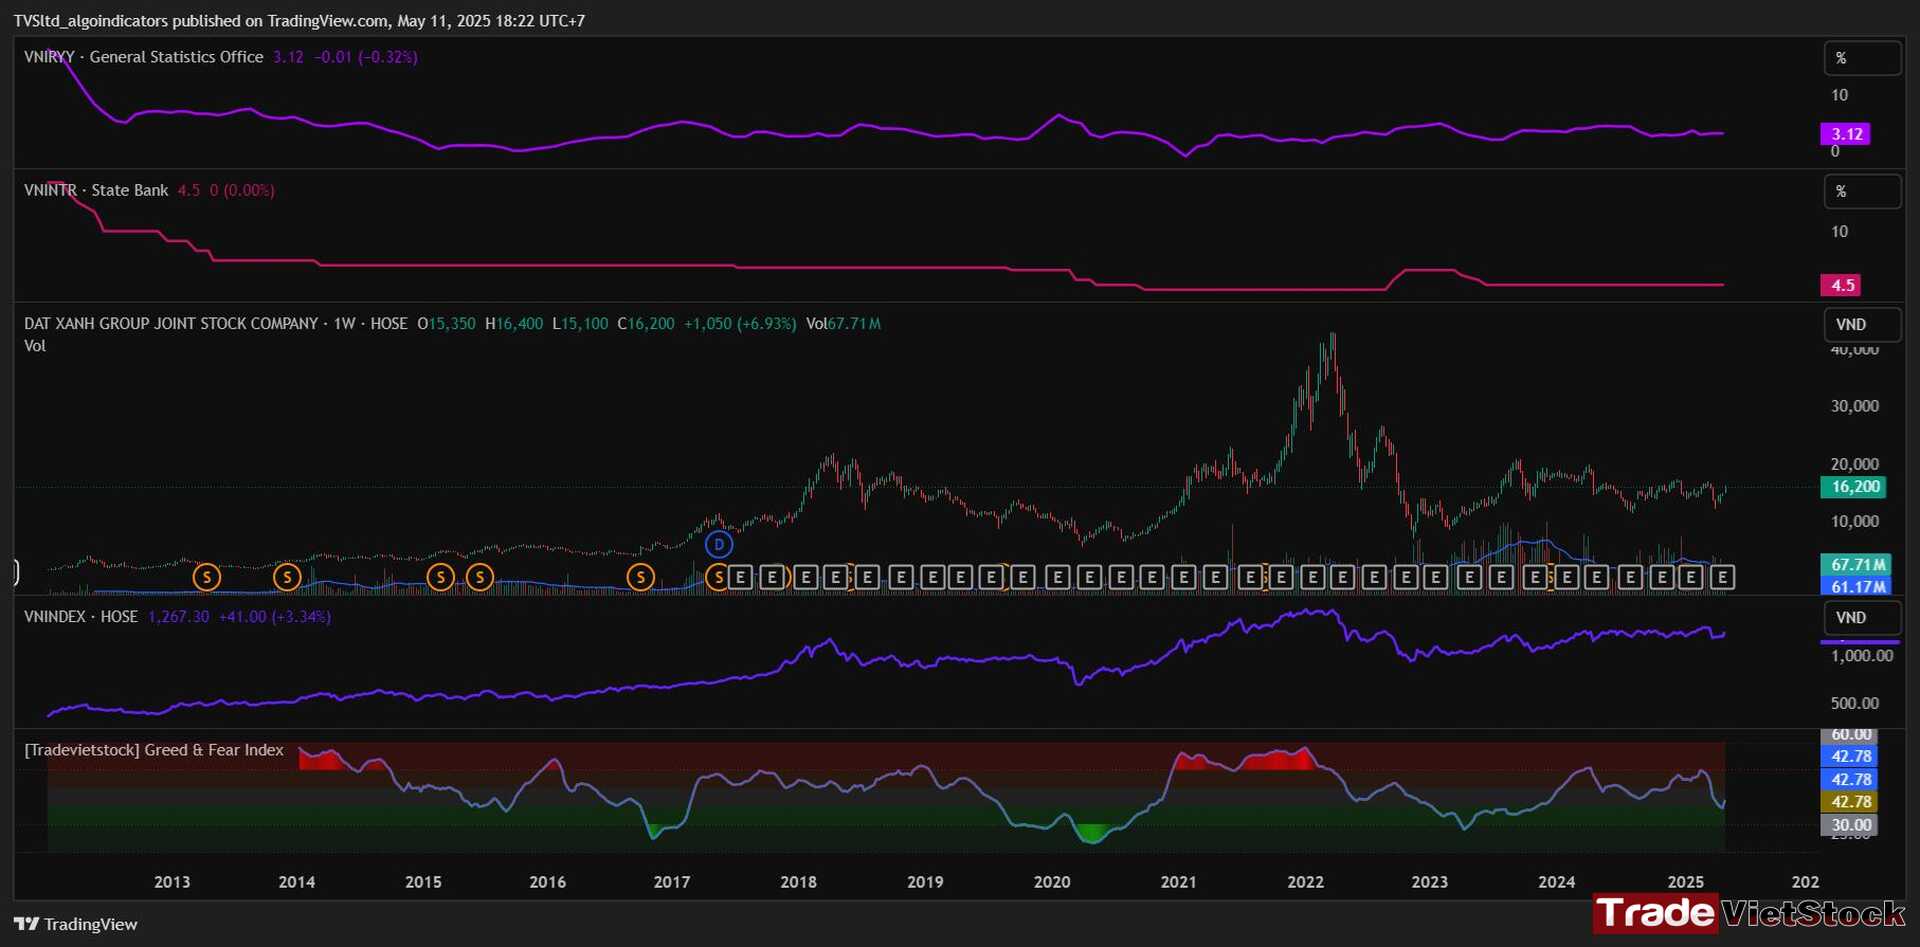
In 2024, Northern regions saw explosive growth, with real estate prices increasing by nearly 77%. Meanwhile, the southern region has seen more modest growth, around 10%. However, there remains significant room for expansion in urban fringe areas like Cần Giờ, Biên Hòa, and Vũng Tàu—regions that are also benefiting from FDI inflows.
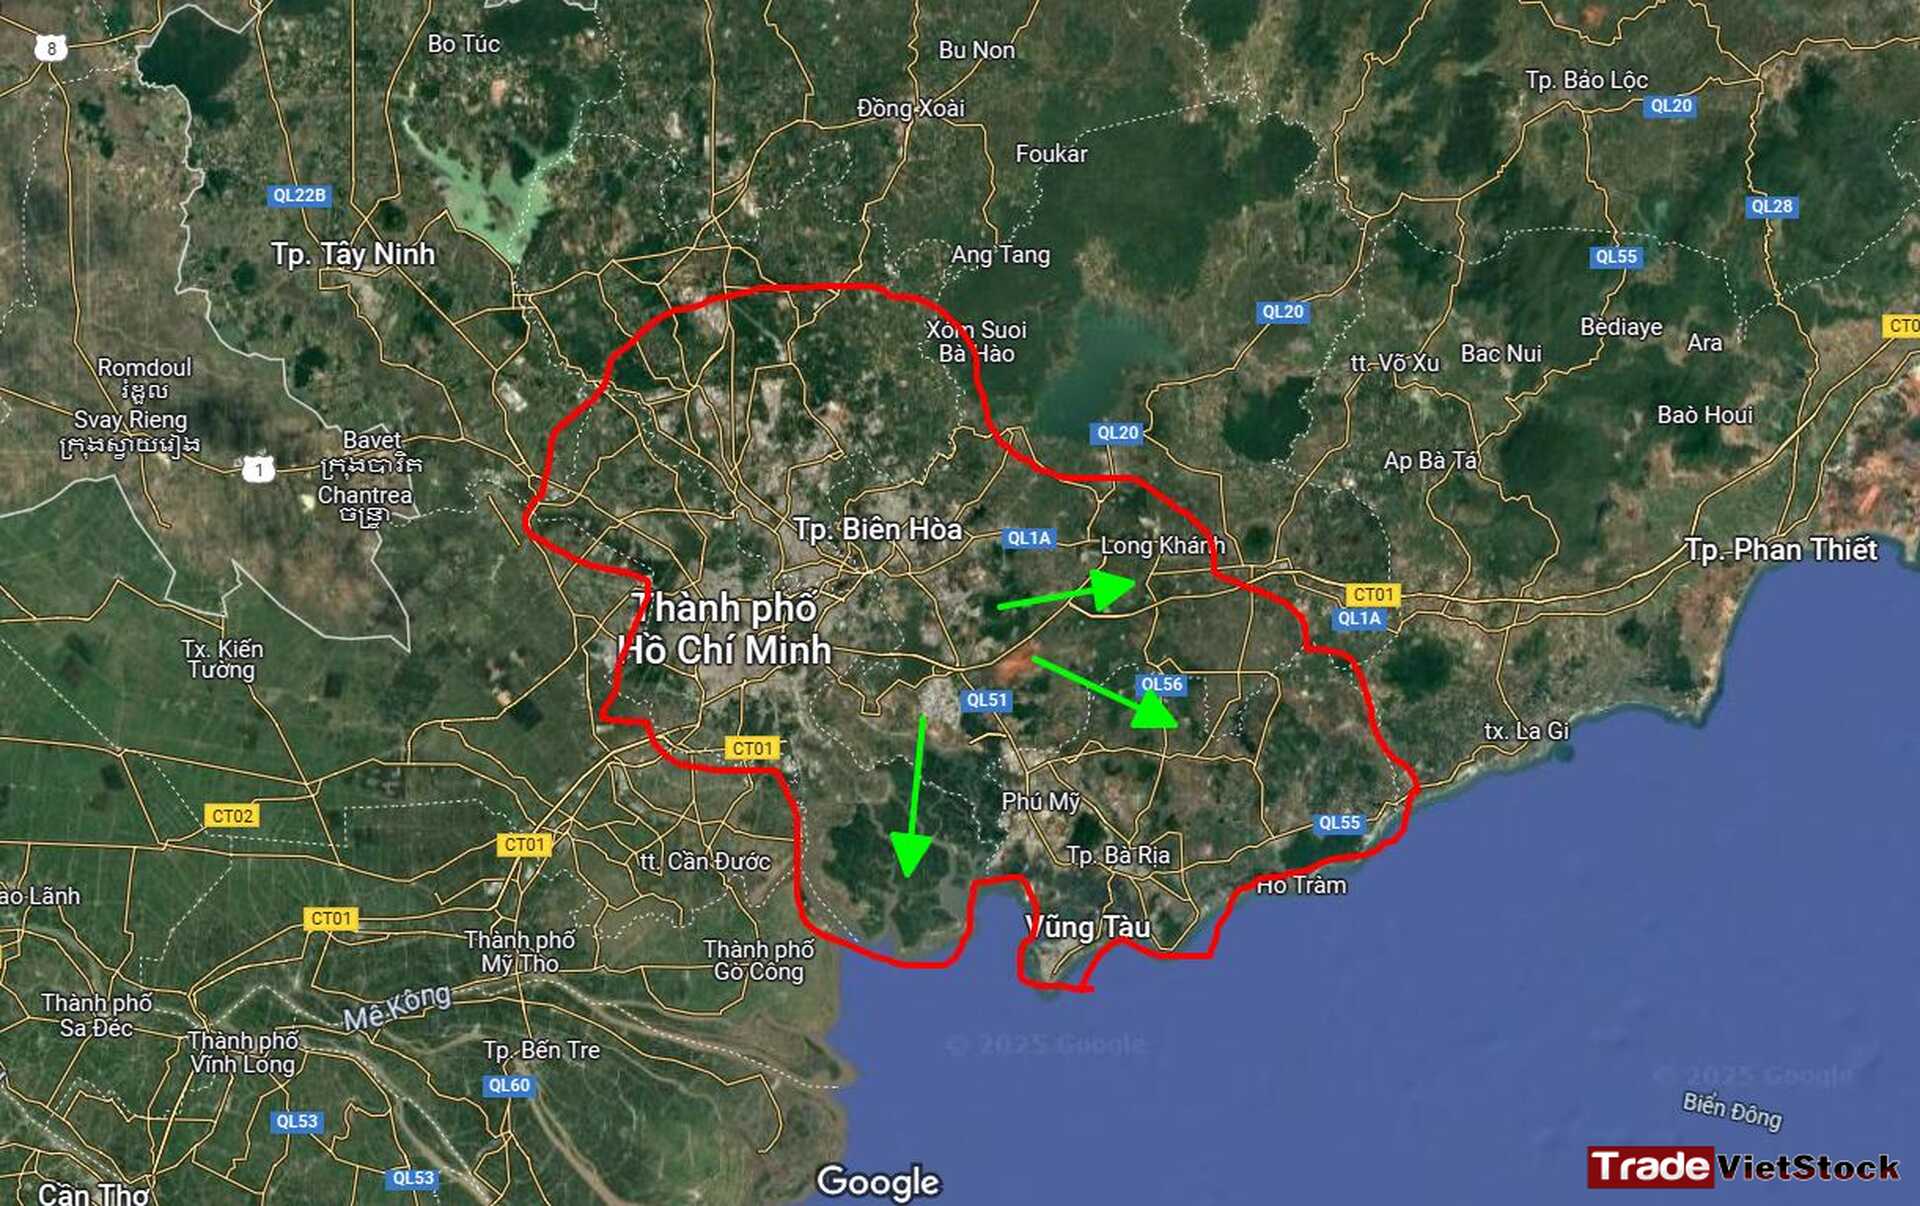
Natural supply and demand dynamics in real estate are heavily influenced by regional economic development policies, in addition to monetary easing. In the current environment, Vietnam’s real estate stocks are expected to show positive growth, supported by a historically low price base and favorable policy conditions.
However, growth prospects will still vary by region, depending on specific factors such as migration trends and regional economic development. This is likely to result in clear divergence in investment performance across different segments and locations.
ii. Real Estate Markets in Capitalist Economies
In capitalist economies, real estate markets operate under the principle of free-market supply and demand, with prices determined by consumer and investor interest. Private entities—including companies and investment funds—are free to develop, buy, sell, or speculate on property with minimal government intervention. The role of the federal government is limited to implementing regional economic policies that indirectly influence housing demand and internal migration.
1. Japan
a. Key Factors Affecting Real Estate Prices
Japan’s real estate growth phases are primarily driven by free-market forces, but are heavily influenced by demographic aging and ultra-loose monetary policy from the Bank of Japan (BOJ). From 2019 to 2024, home prices in Japan rose by 41%, primarily in major cities like Tokyo and Osaka, while rural areas saw price declines due to depopulation. Key price drivers include:
Monetary Policy Cycles:
The BOJ kept interest rates near zero—and even negative from 2016 to 2023—to stimulate the economy. This resulted in cheap capital flowing into real estate, particularly in Tokyo, where the average apartment price reached 90 million yen (~$600,000 USD) in 2024 (OECD).
However, since late 2023, the BOJ has begun modest tightening (raising rates to ~0.25%), leading to a 10% drop in real estate transactions in Tokyo’s suburbs in 2024. The earlier stimulus phase also attracted foreign capital (notably from China and Singapore), driving commercial land prices in areas like Ginza up 15% between 2021 and 2025.
Growth Potential:
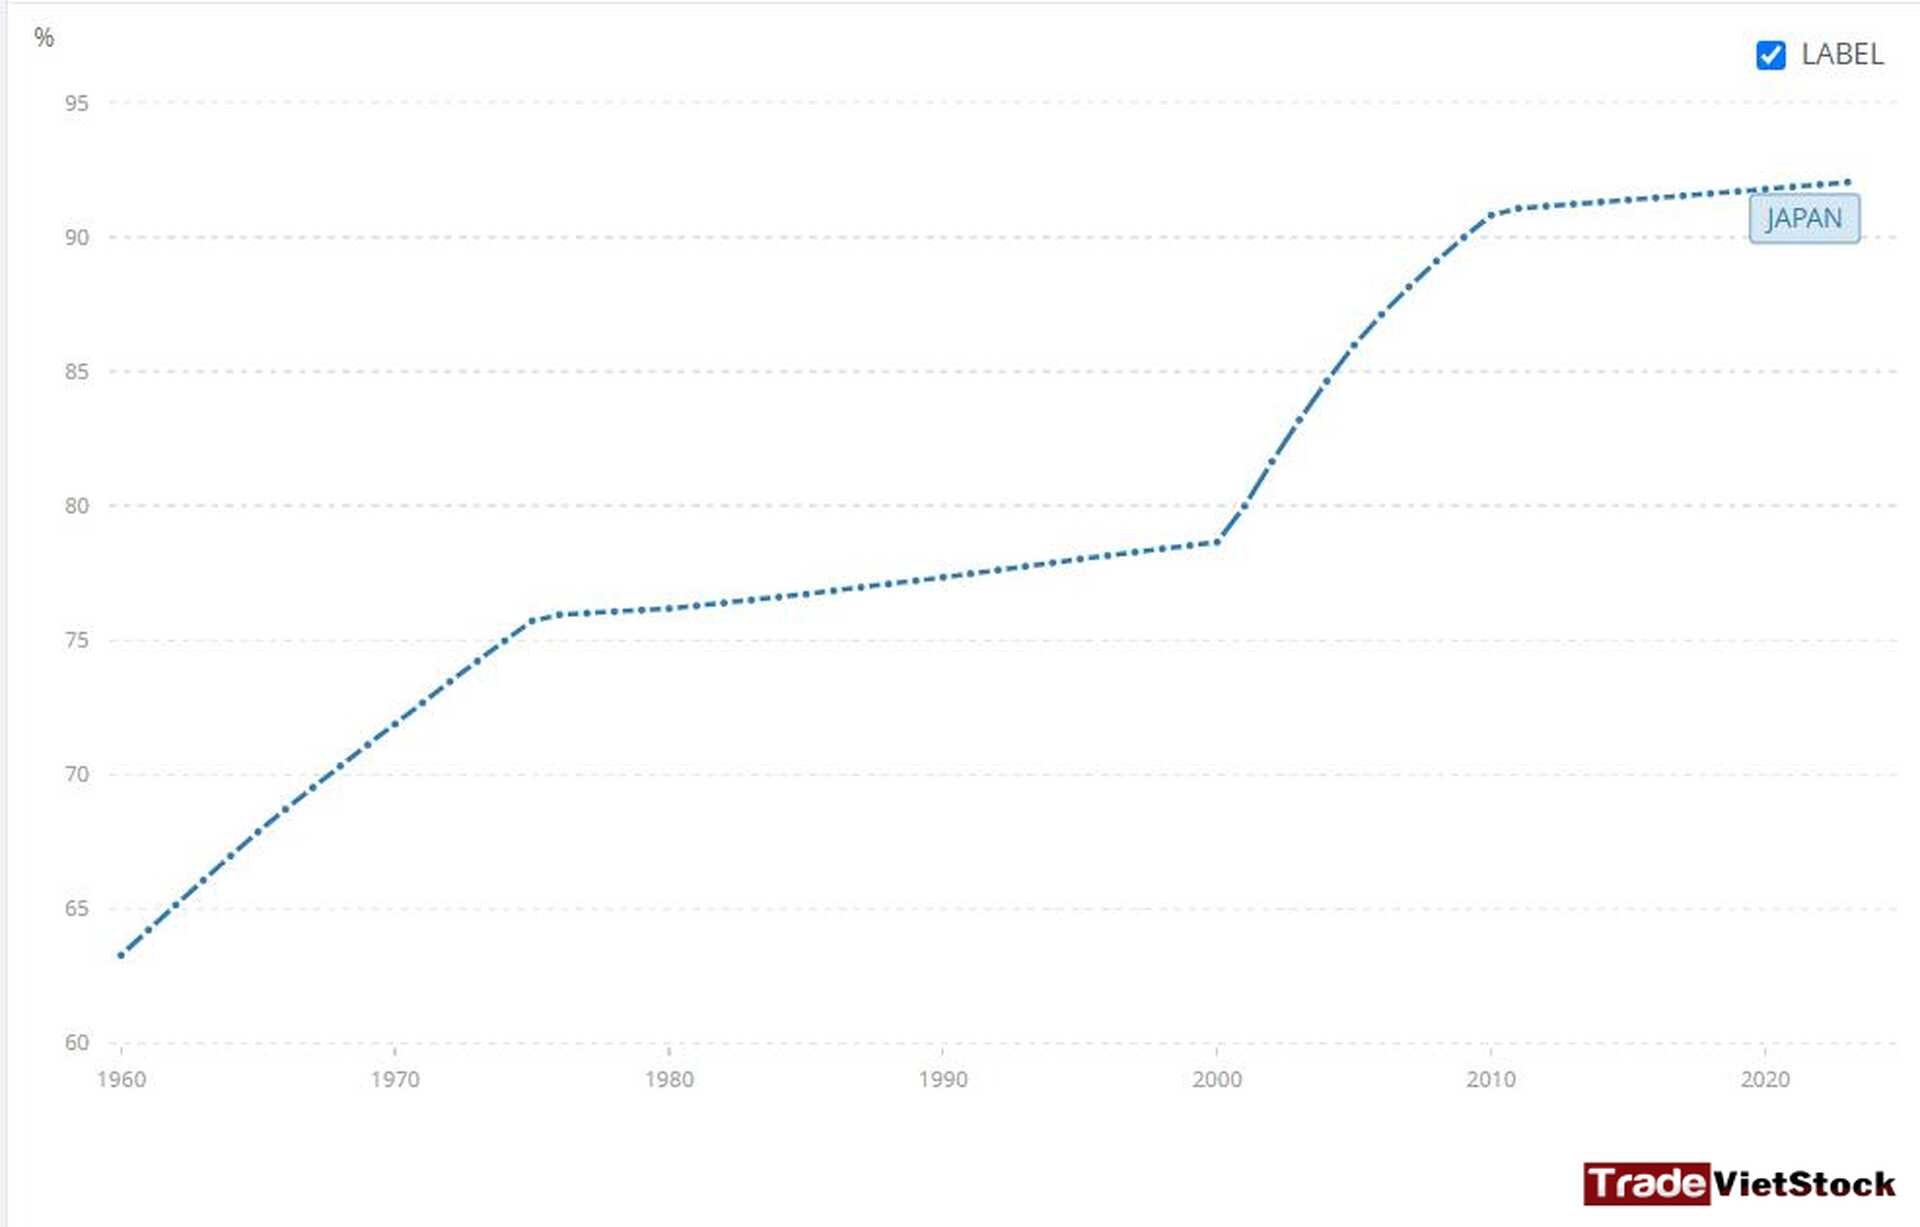
Japan’s urbanization rate is already very high—around 94%—meaning that nearly the entire population resides in urban areas. This high saturation limits further growth potential in real estate demand.
Demographics and Birth Rate:
Japan faces a record-low fertility rate of 1.2 children per woman (2023), causing the population to decline from 125 million in 2020 to an estimated 123 million in 2025. This trend reduces long-term housing demand, especially in rural areas such as Hokkaido, where prices fell 20% between 2015 and 2025. Meanwhile, Tokyo continues to attract internal migrants (1.5 million people from 2020 to 2025), sustaining demand for high-end housing and office space.
Japan’s declining population points to shrinking real estate demand. In this context, internal migration is the only remaining factor that can support price increases. However, with 94% of the population already urbanized, the market has little room left for expansion. This reflects a classic case of a real estate market reaching the mature, saturated stage of its development cycle.
Real Estate Prices by Region:
- Tokyo: Strong demand due to economic concentration (30% of Japan’s GDP), an influx of young professionals, and foreign capital. Projects like Toranomon Hills (condos priced at $2–10 million USD) saw 10% price growth in 2024, supported by new infrastructure (railway stations, Olympic legacy).
- Osaka: Growth driven by the upcoming Expo 2025 and the integrated resort (IR) casino development, with home prices in Umeda rising 12%.
- Rural Areas (e.g., Hokkaido, Tohoku): Demand is declining due to aging populations and urban migration, leading to falling prices and abandoned homes (8.5 million vacant houses in 2023, according to Nomura). Environmental pollution in aging industrial zones has also depressed prices by 0.5% due to rising PM2.5 levels.
Japan’s real estate market is now considered saturated, as structural factors like population aging and historically low birth rates constrain further expansion. Current monetary tightening will likely place additional pressure on the market.
Unlike in many emerging markets, government intervention plays a minimal role in Japan’s real estate, aside from monetary policy and regional economic strategies. The primary price driver remains actual usage demand.
b. Real Estate Stocks
Japan’s real estate prices surged in the decades before 1990. Since entering the 21st century, however, the market has remained relatively stable. Although there have been several price rallies—especially post-2006—the overall volatility is much lower than in earlier decades.
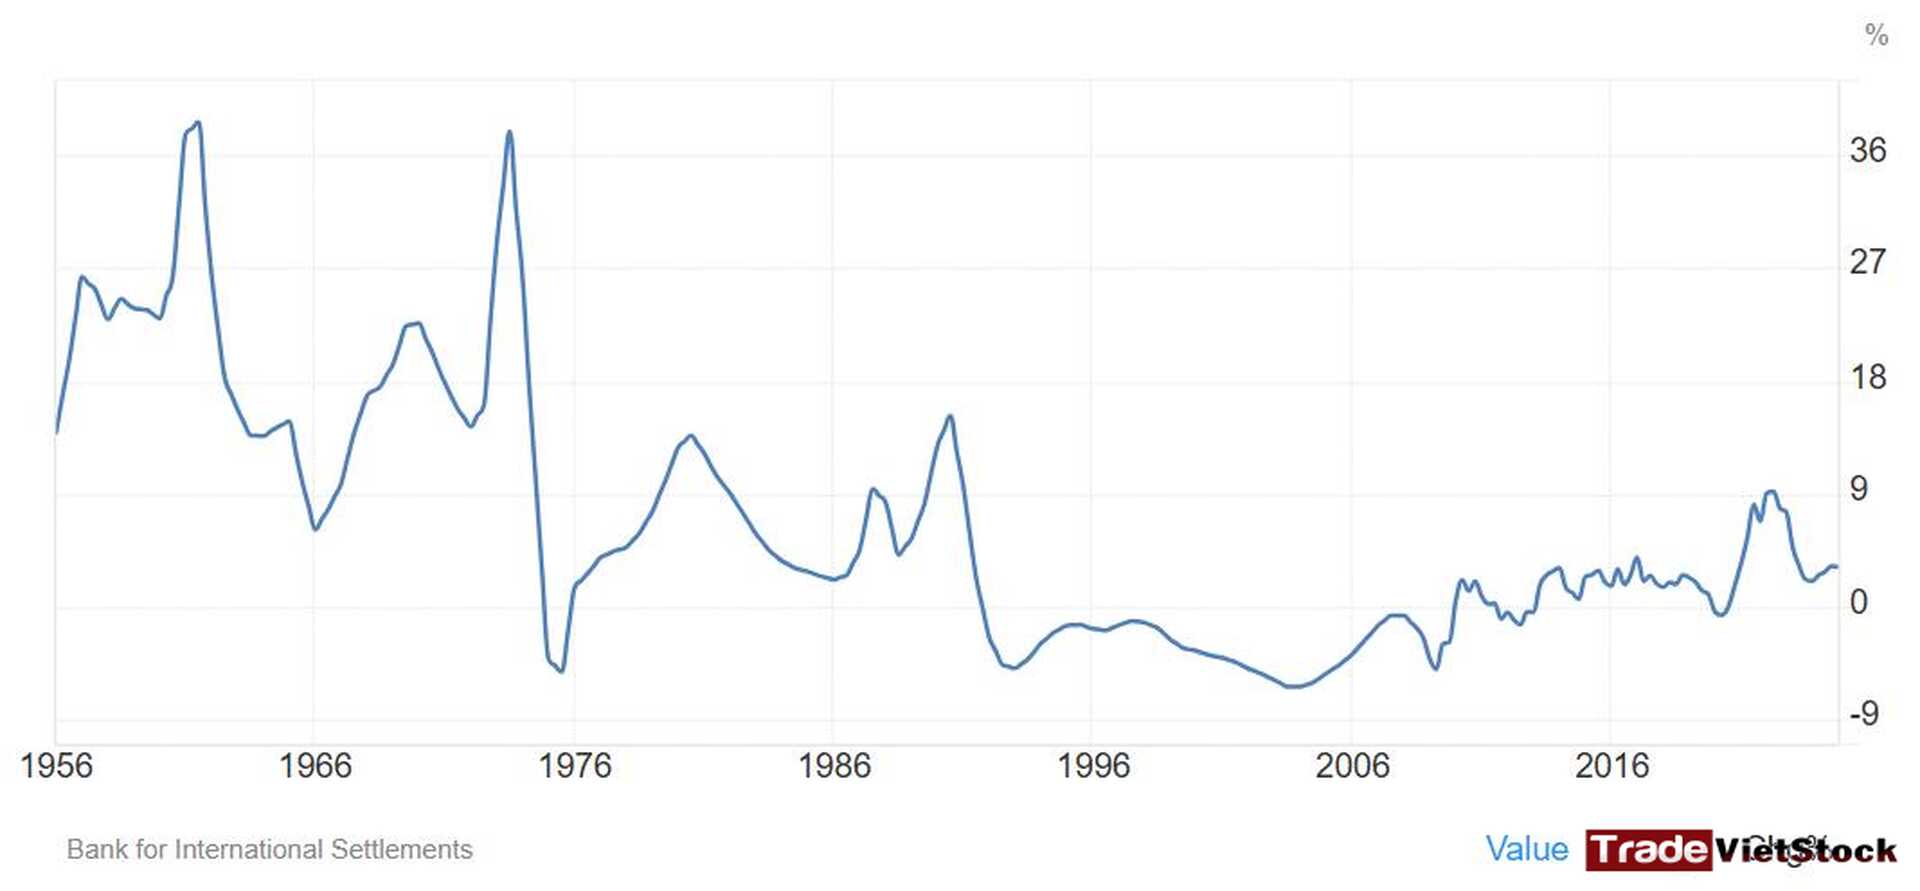
Japanese real estate stocks tend to experience notable growth only in the final phases of monetary easing cycles. Annual inflation (YoY) is typically positive, with the ideal range being around 2%.
Notably, there is a strong correlation between real estate prices and stock performance. For example, Sumitomo’s real estate stock posted significant gains during 2006–2007, 2013–2014, and again in 2023—periods that align closely with upward trends in Japan’s House Price Index.

Periods of deflation or inflation above 3% tend to negatively affect the real estate market. However, in general, inflation itself does not strongly correlate with the growth of real estate stocks in Japan.
The most favorable conditions for growth in Japanese real estate stocks are at the tail end of monetary easing cycles, paired with rising property prices.
Given the current monetary tightening in Japan, real estate prices are expected to enter a correction phase lasting 1–2 years before any potential recovery.
2. United States
The growth phases in the U.S. real estate market exemplify natural supply and demand dynamics and regional fluctuations driven by interest rates, migration, and investment demand. The federal government mainly influences the market indirectly through Federal Reserve (FED) policies and infrastructure investment, while private players like Zillow and Blackstone dominate development and pricing.
a. Key Factors Affecting Real Estate Prices
Monetary Tightening and Stimulus Cycles:
The FED raised interest rates from 0.25% in 2020 to 4.25–4.5%, causing a 15% decline in home sales growth in 2024 (NAR), especially in expensive states like California. Mortgage rates hit 6.87% in 2025, leading to a 5% price drop in San Francisco homes from their 2022 peak.
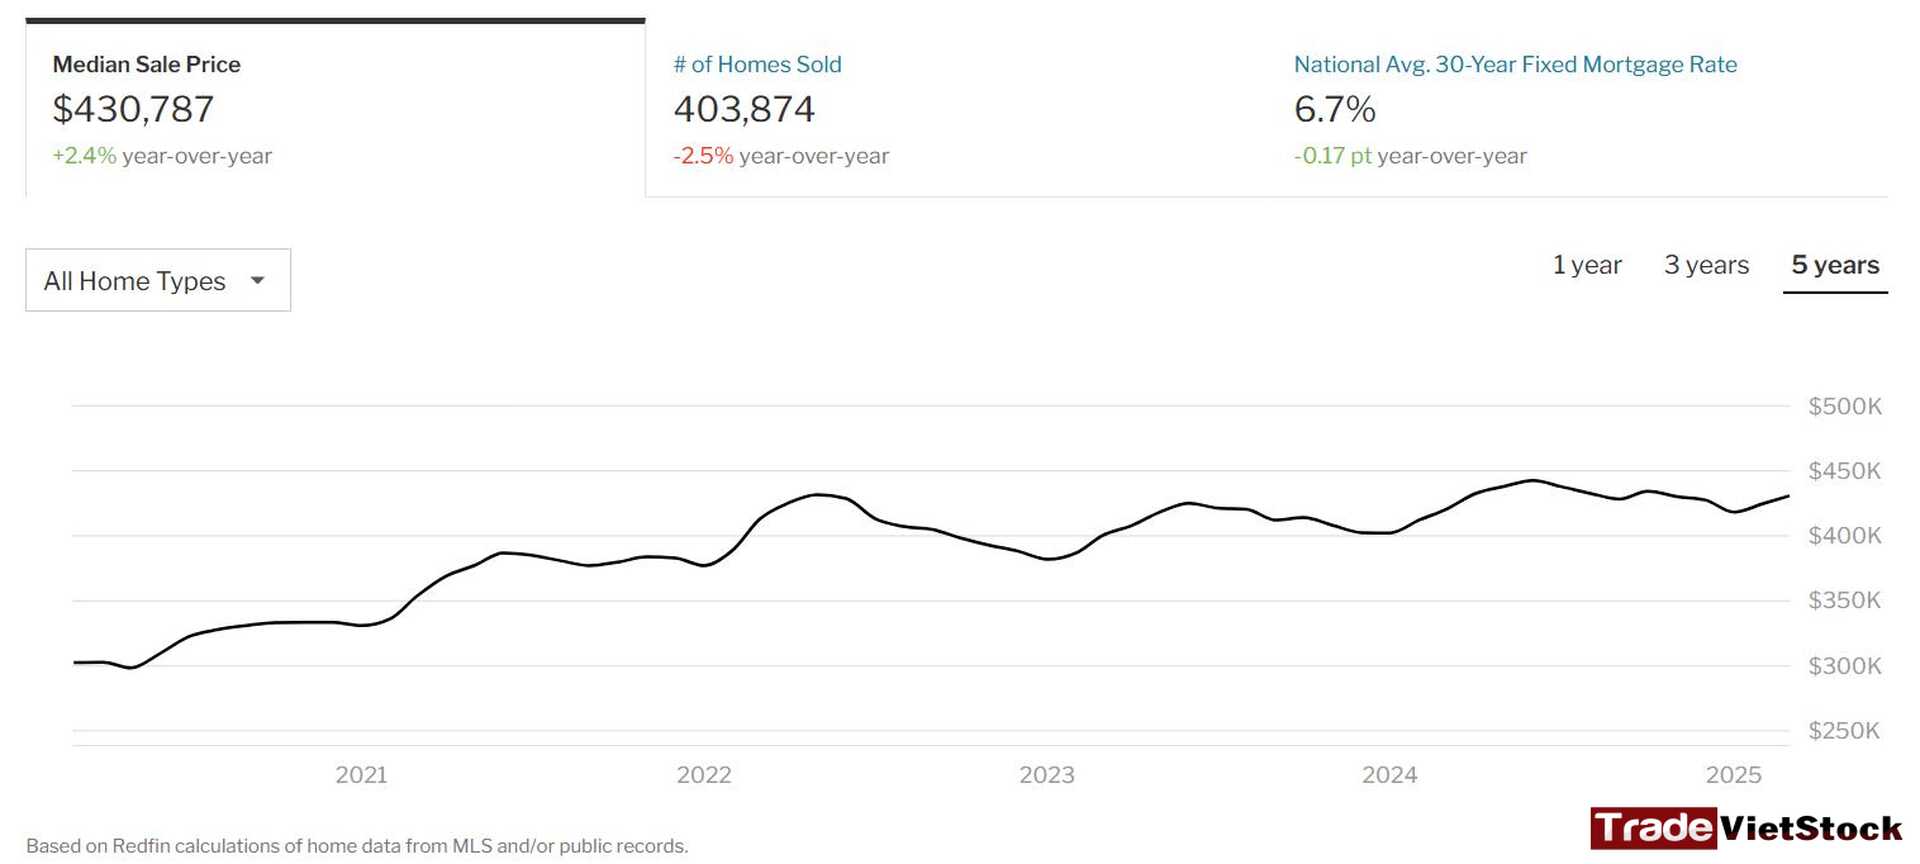
Conversely, the 2020–2021 stimulus period—with $2 trillion in aid—pushed home prices up 20%, fueled by demand in suburban areas. The current tightening cycle has constrained new housing supply.
Birth Rate and Population:
The U.S. birth rate fell to 1.6 children per woman in 2023 (CDC), below replacement level (2.1), but the population continues to grow due to international migration (~1 million annually). Demand is rising in “emerging” states like Texas, where population grew 5% from 2020–2025 (Census Bureau), pushing Austin home prices up 30% to around $400,000.
In contrast, older industrial states like Michigan have stagnating populations, with Detroit home prices increasing only 5% over the same period.
Regional Price Divergence:
- Miami, Florida: Strong demand driven by low taxes (no state income tax), domestic migration (from New York and California), and foreign investment from South America. Home prices rose 15% in 2024 (Case-Shiller), with luxury condos priced between $5–50 million.
- Austin, Texas: Attracts tech startups (Tesla, Oracle) and a young, growing population, with home prices rising 10% in 2024.
- San Francisco, California: Prices declined 5–10% due to high interest rates, high cost of living, and remote work trends prompting outmigration. Air pollution (PM2.5) near the Port of Oakland contributed a 0.5% price decline.
In the U.S., real estate growth phases largely reflect natural supply-demand factors such as migration flows, price levels, and quality of living environments. Fiscal policy tends to play a supporting, rather than leading, role.
b. Real Estate Stocks in the U.S.
U.S. real estate prices saw strong growth phases before 2006, after the 2008 financial crisis, and post-COVID-19 in 2020—all periods characterized by monetary easing and large-scale liquidity injections.
Since federal interest rates have risen and remain high, the House Prices Index has retreated significantly from its 2022 peak.
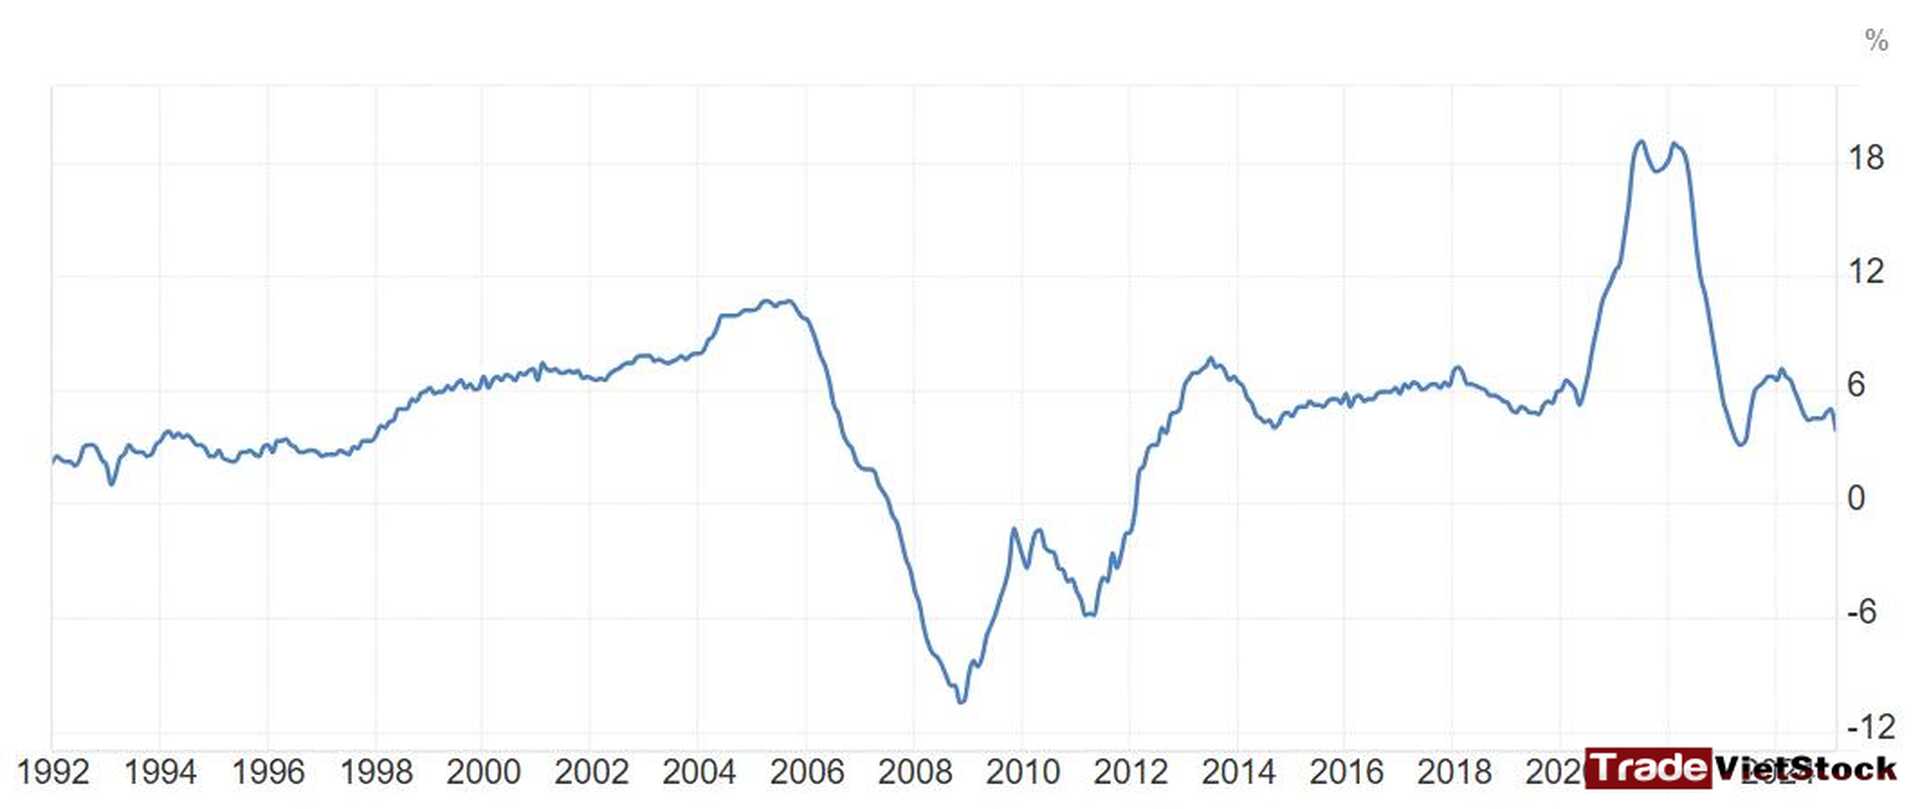
Real estate stocks in the U.S. tend to move closely with the House Prices Index and monetary easing cycles. Interestingly, during high inflation phases, real estate stocks sometimes outperform.

Given the FED’s ongoing tight monetary policy and the stagnation of the House Prices Index, significant stock growth in the sector is unlikely. Exceptions may include companies holding large land portfolios in hotspots like Miami, where strong migration and rising demand persist.
Similar to Japan, U.S. real estate prices depend heavily on natural demand factors—particularly migration trends. While many residents are leaving expensive cities like New York and San Francisco, they are relocating to suburbs or cities offering tax advantages and better living conditions, such as Miami.
The federal government’s role is primarily in policy-setting and infrastructure investment, which indirectly stimulate real estate demand and population shifts. However, fiscal policies at the federal level often don’t align perfectly with regional economic realities, resulting in pronounced disparities among local markets.
3. Common Themes and Cyclicality
A clear similarity across developed capitalist real estate markets is that price trends are mainly driven by natural supply and demand dynamics within specific regions, leading to strong geographic differentiation. Fiscal policies typically have a macro-level, indirect influence, mainly affecting mortgage rates and financing incentives.
Another common characteristic is that these markets are highly developed, with high urbanization rates. Countries maintaining birth rates above 1.5 generally retain potential for population growth—a key driver of long-term housing demand.
However, within specific regions, price trends depend more on domestic migration and local or federal policy responses than solely on centralized fiscal policy.
iii. Common Themes in Real Estate Growth Cycles
Despite operating under different economic models, real estate markets in Japan, the U.S. (capitalist), China, and Vietnam (socialist-oriented) share many key characteristics in their growth phases. These commonalities reflect the interplay of natural supply and demand, fiscal policy, and demographic trends. Understanding these helps explain price movements and reveals investment opportunities and risks—especially for real estate stocks in Vietnam.
1. Natural Supply-Demand and Fiscal Policy Work Hand in Hand:
Every real estate growth cycle is driven by natural supply-demand dynamics, with demand surging in migration hubs and investment hotspots. In Japan and the U.S., prices rose in Tokyo and Miami due to internal migration and foreign capital, while rural areas like Hokkaido and Detroit saw declines amid population loss.
In China and Vietnam, supply and demand are strongly shaped by policy: a 1 trillion CNY rescue package pushed Beijing prices up 5%, while a 350 trillion VND stimulus boosted Hanoi apartment prices by 77.6%. Fiscal policy cycles (loosening/tightening credit) amplify or restrain demand: stimulus phases (U.S. 2020–2021, Vietnam 2007–2008) lifted prices 20–70%, whereas tightening cycles (FED 4.25–4.5%, BOJ 0.25%) slowed transactions by 10–40%.
2. Birth Rates and Urbanization Shape Long-Term Demand:
Low fertility rates (Japan 1.2, China 0.8, U.S. 1.6, Vietnam 1.91) reduce long-term housing demand, especially in Japan (population down 2 million) and China (down 10 million from 2020–2025). However, urbanization and internal migration compensate: Vietnam (38% urbanized) and China (66.2%) still have room to grow, with Hanoi and Shanghai attracting 1–2 million migrants yearly. Japan (94% urbanized) is nearly saturated, so price growth is mostly confined to major cities. Areas with poor infrastructure or pollution (Hokkaido, Hebi) saw prices drop 0.3–20% due to weak demand.
3. Strong Correlation Between Real Estate Prices and Real Estate Stocks:
Real estate stocks tend to move in sync with home prices and monetary easing cycles. This pattern holds true across capitalist and market-oriented socialist economies. When property prices rise, sector stocks typically follow. The extent of real estate stock booms depends on both market potential and actual growth drivers.
4. Outlook for Vietnam:
Vietnam currently has significant growth potential in real estate. Hanoi’s housing prices have increased 77.6%, and Ho Chi Minh City’s by 10% recently, with more growth expected over the next 1–2 years, supported by credit easing and infrastructure projects like Thu Duc city and Ring Road 4.
However, “prime land” status isn’t permanent. Risks such as tightening credit or oversupply—similar to China’s situation—could trigger market corrections. Additionally, falling birth rates limit internal migration, constraining demand. This suggests some areas may soon face saturation, ending previous price growth momentum.
5. US Real Estate Stock Outlook
Miami’s real estate market is booming, driven by strong domestic migration, no state income tax, and significant foreign investment. Because of this, real estate stocks with exposure to Miami are positioned well for growth.
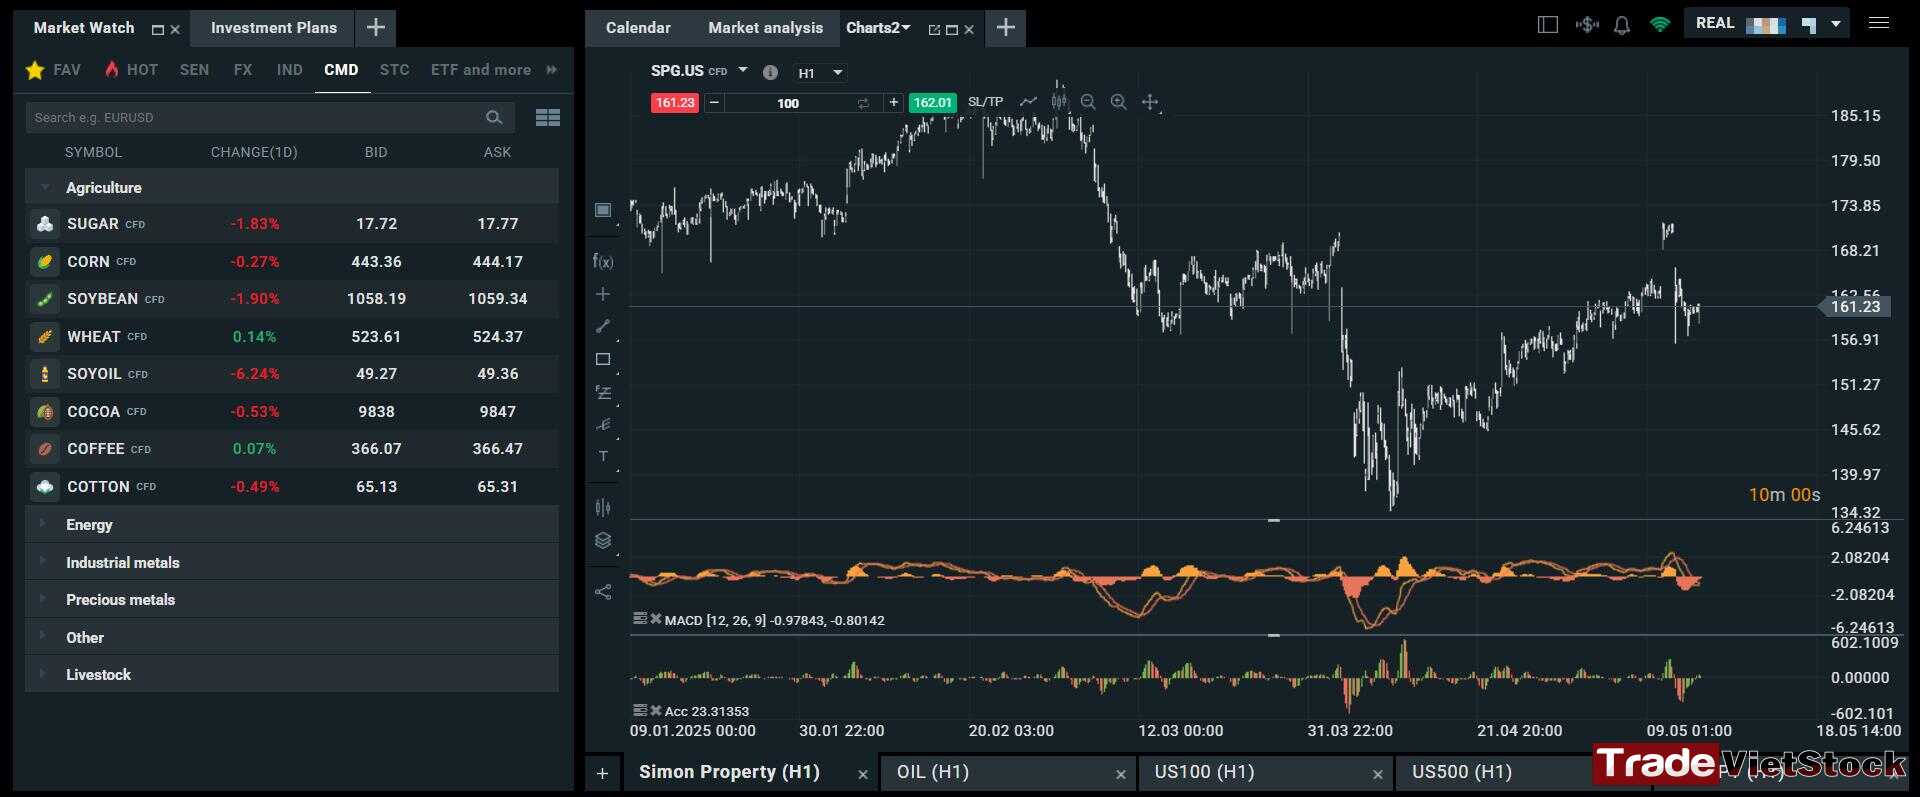
In contrast, markets like New York are largely flat due to extremely high property prices and rising living costs, which are limiting demand and price appreciation.
So, if you’re looking to invest in US real estate stocks, focusing on companies with Miami exposure is a smart play in today’s market environment.
iv. Conclusion
The stages of real estate growth are primarily driven by natural supply and demand, amplified by fiscal policy and shaped by urbanization and migration trends. During monetary easing, real estate stocks often become attractive investment channels due to expectations of asset price appreciation.
Investors should be selective: prioritize companies operating in regions with strong development potential, supported by infrastructure planning, regional economic policies, and balanced supply-demand fundamentals.
Conversely, avoid investing in areas that have entered saturation after strong growth—a clear lesson from major cities like New York, where real estate prices plateau due to stagnant population growth and high living costs.
Regions combining growth potential, positive migration flows, and clear policy support will be the future hotspots for real estate price appreciation—creating superior opportunities for real estate stocks.
Furthermore, if you want real-time signals everyday, you can check out our small Investment and Trading community on Telegram: [HERE]
Don’t forget to follow this Investment and Trading Signal for free investment analysis and trading crypto and forex CFDs signals.
📌 Interested in learning more about different account types or trading knowledge? Check out our educational resources HERE
I know trading isn’t an easy game, especially for those who take it seriously. That’s why I believe you should practice consistently before finding the trading strategies that suit you best. You can start risk-free by opening a demo FX account to get familiar with the market.
Below are registration links for two of the best brokers:
- XTB Online Trading — the top broker for traders in the EU
- Exness — the best choice for traders in Asia
You can also experience world-class services and trusted reputations from some of the top 5 crypto exchanges:
- Binance — The largest crypto exchange on Earth
- Bybit — A well-established name known for its long-standing reputation and diverse financial instruments
- Bitget — User-friendly interface combined with a strong reputation
- MEXC — The lowest trading fees with one of the most beginner-friendly interfaces
- OKX — A major name known for secure asset storage and powerful DEX tools


 Tiếng Việt


