Trade with market cycles
| Date: 20/04/2025 | 706 Views | Investment and Trading Academy |
Trade with market cycles: Best technique for mid-term investors
Hello folks, it’s Tradevietstock again! Have you ever heard of market cycles? These are patterns that stocks, indices, commodities, and even cryptocurrencies tend to follow and repeat over time. Today, I’ll introduce you to this theory and help you trade with market cycles. If you can grasp this theory and incorporate it into your trading strategies, you could see significant success in just a few years.
i. Market cycle theory
Many traders are familiar with Wyckoff’s theory, which, while foundational, can feel outdated and inefficient for real-life trading in today’s fast-paced markets. It takes time to apply and may not be the most practical approach. That’s why many turn to day trading, but without the right tools and strategy, it can lead to account blow-ups.
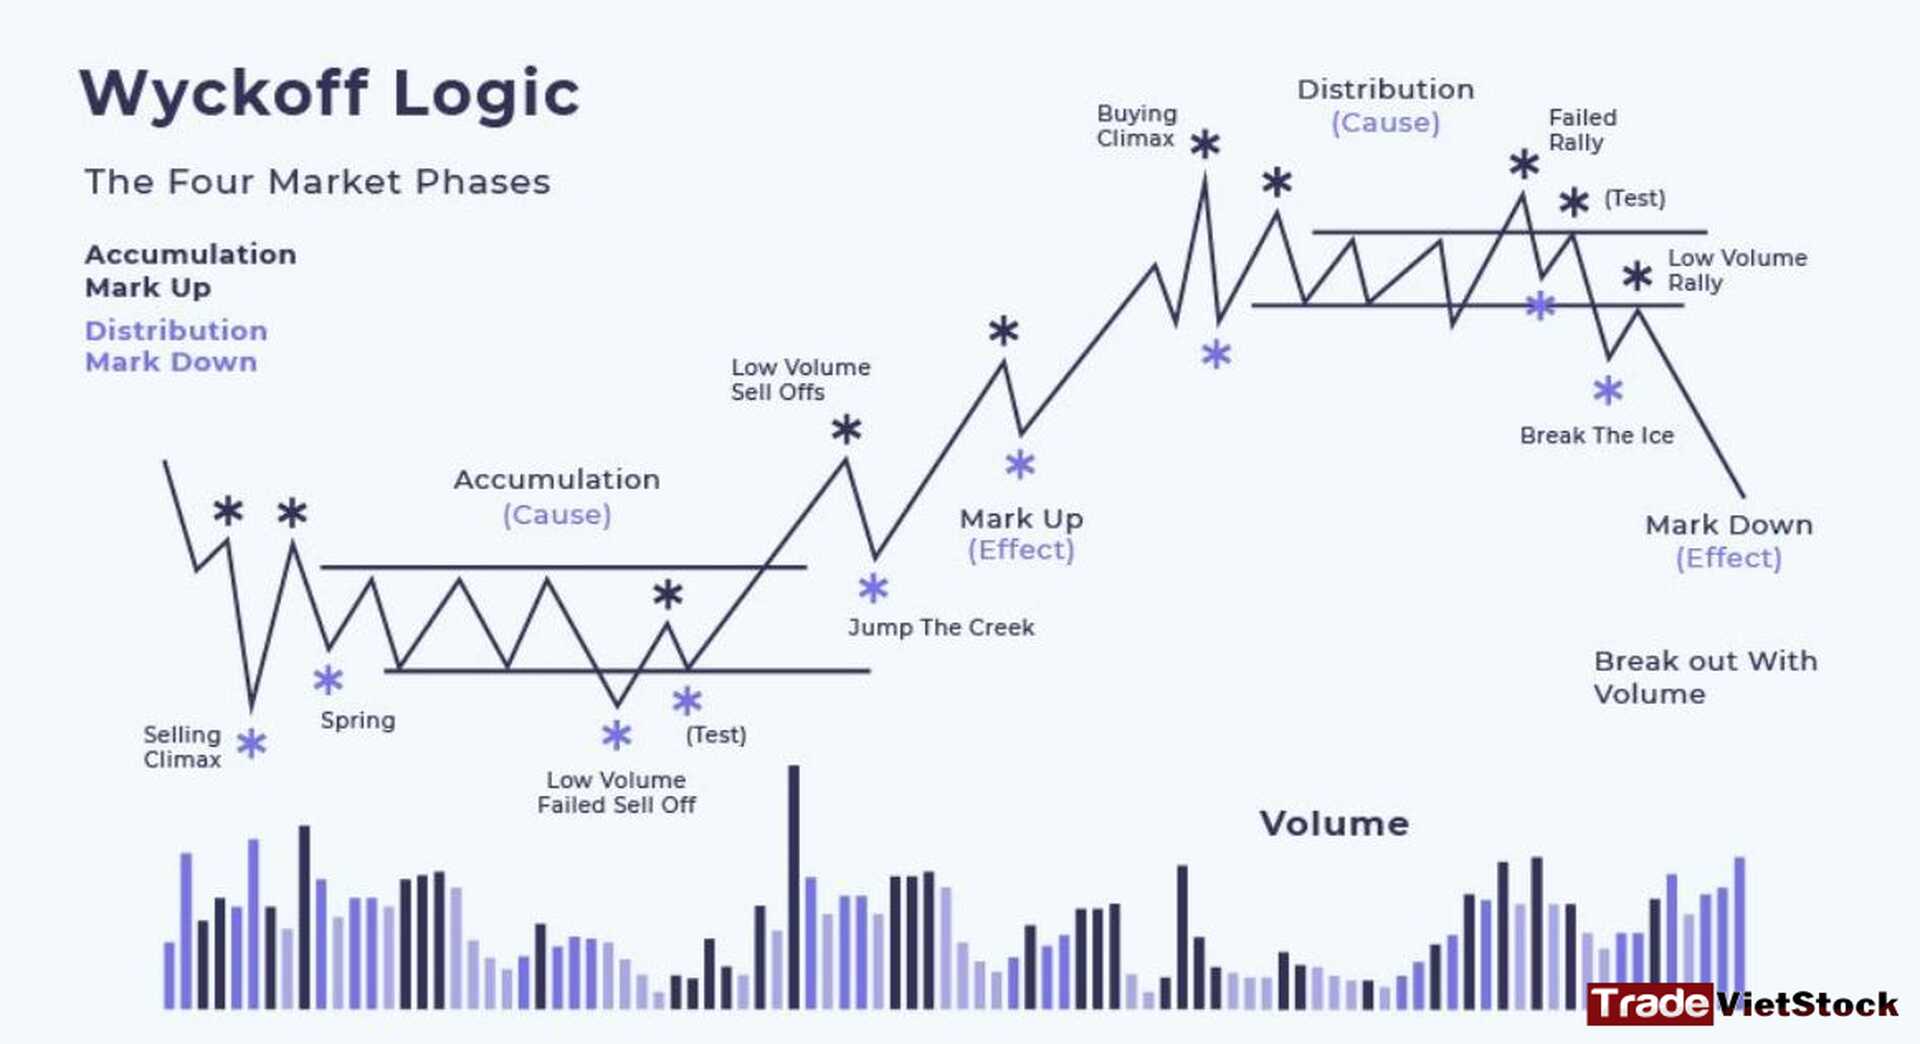
The traditional market cycle consists of four stages: accumulation, markup, distribution, and markdown. While this is accurate, it’s not always sufficient for modern trading. We need something more practical.
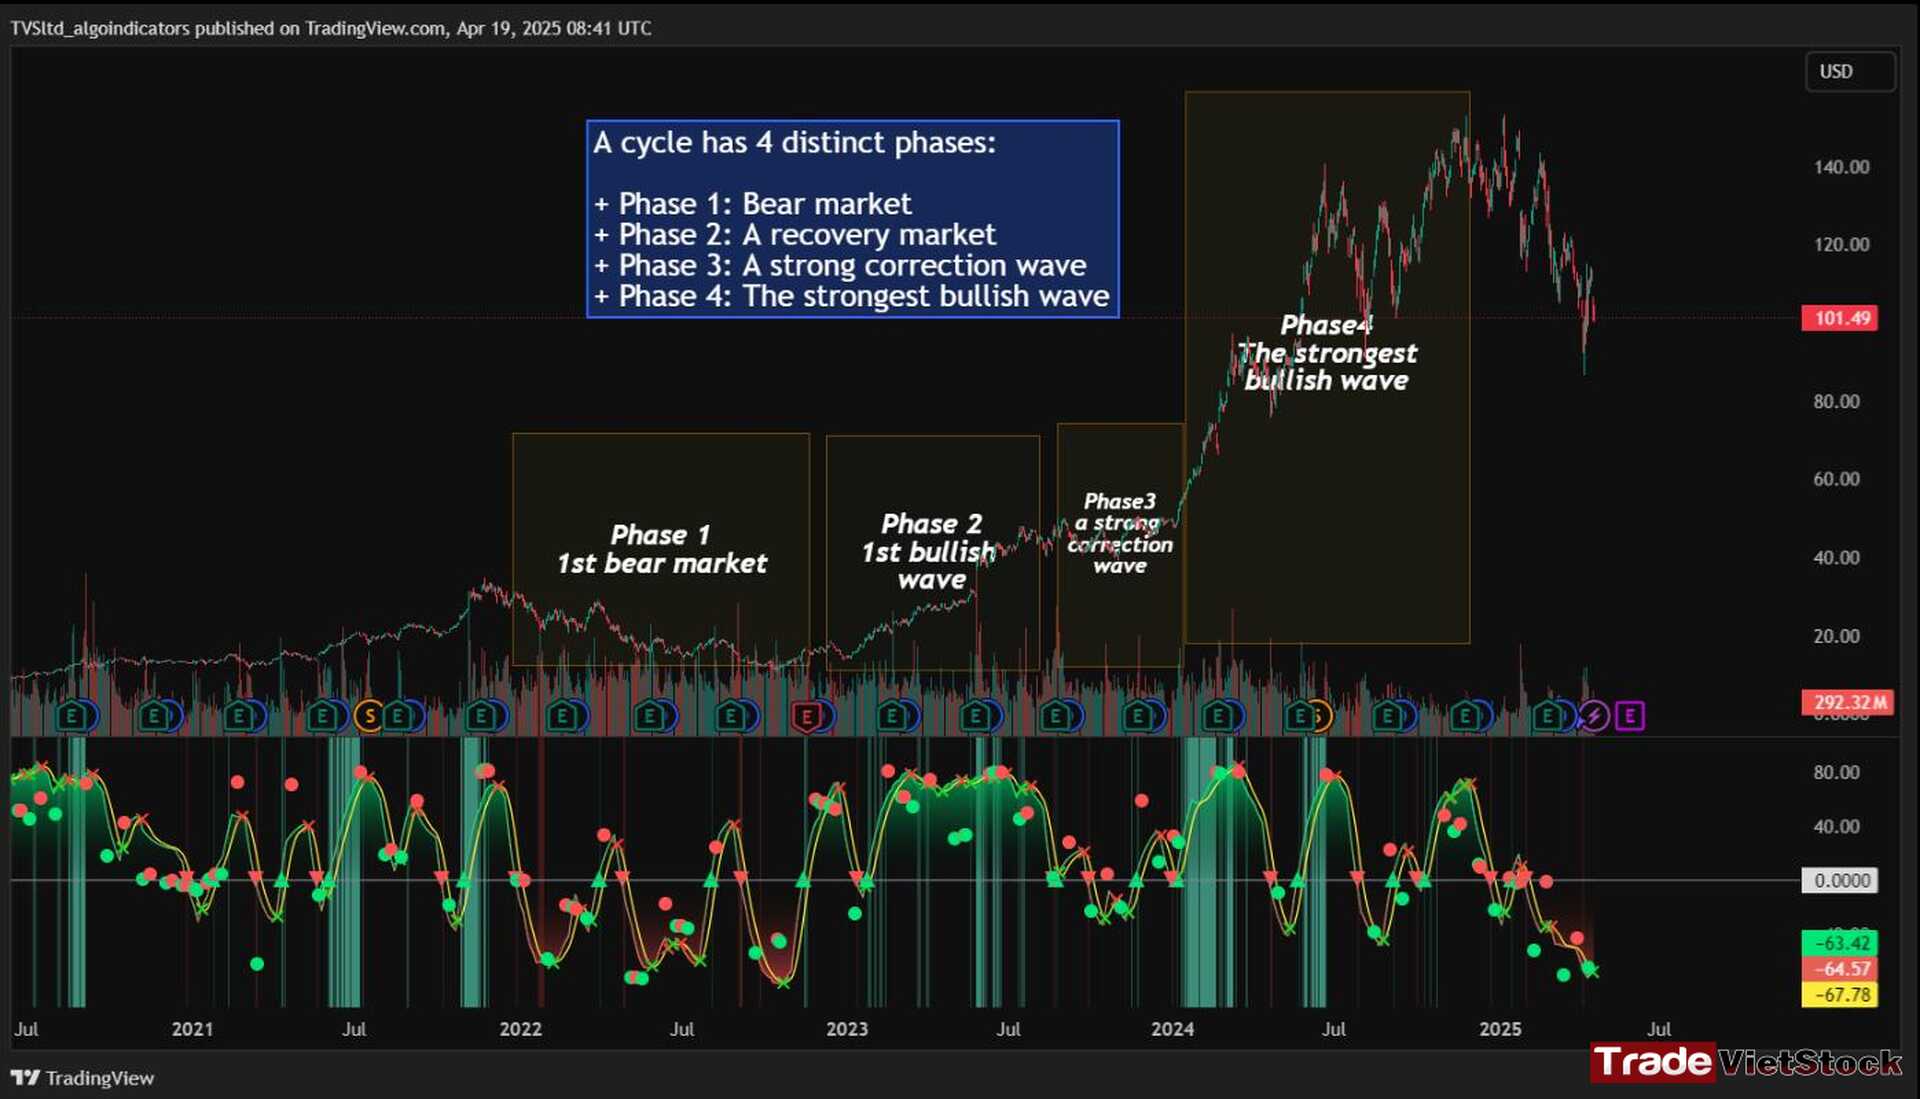
According to Tradevietstock’s theory, the market cycle can be broken into four stages: a bear market, recovery, correction wave, and a bull market (the strongest uptrend). This new approach offers a shorter and more efficient timeline compared to Wyckoff’s or other older cycle theories, making it a safer and more practical alternative to intraday trading.
To trade with market cycles, you need to remember these four stages:
- Bearish Phase – Bear Market
- First Bullish Wave – The Recovery
- Strong Correction Phase
- Final Bullish Wave
ii. Practice with Quantum Flux indicator and market cycles theory
Quantum Flux generates visual and data-driven signals to help you time your trades accurately.
- Green Dots: MACD crossover → Potential buy signal
- Red Dots: MACD crossunder → Potential sell signal
- Quantum Aroon Crossover: Confirms bullish trend or Buy Signals
- Quantum Aroon Crossunder: Confirms bearish trend or Exit Signals
- Green background: Extreme Bullish Phase
- Red background: Extreme Bearish Phase
So that’s the theory, now let’s move to the practice. I will walk you through how to trade with market cycles. Let’s look at an example to better understand Phase 1: The Bear Market. This phase starts only after a previous uptrend in the stock price. It’s important to note that Phase 1 doesn’t mark the beginning of the overall trend; rather, it signals a reversal following a bullish run.
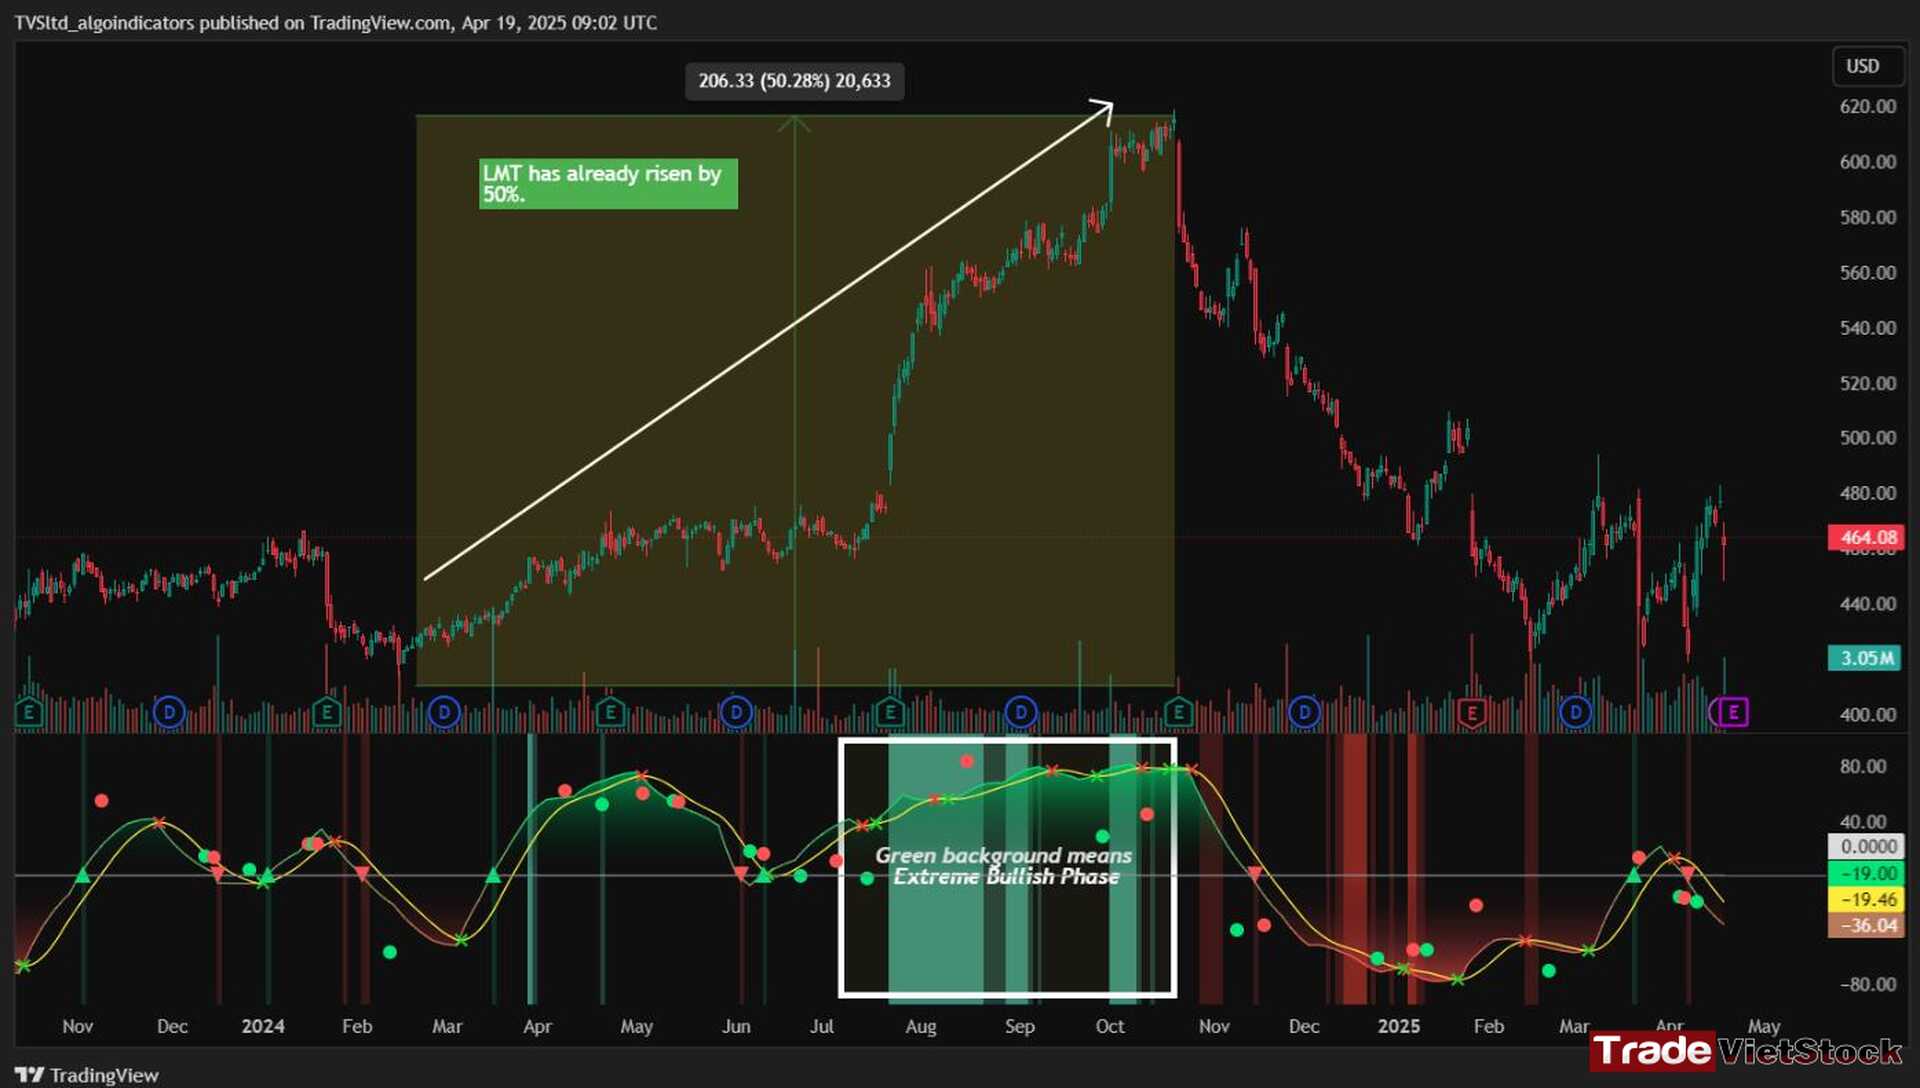
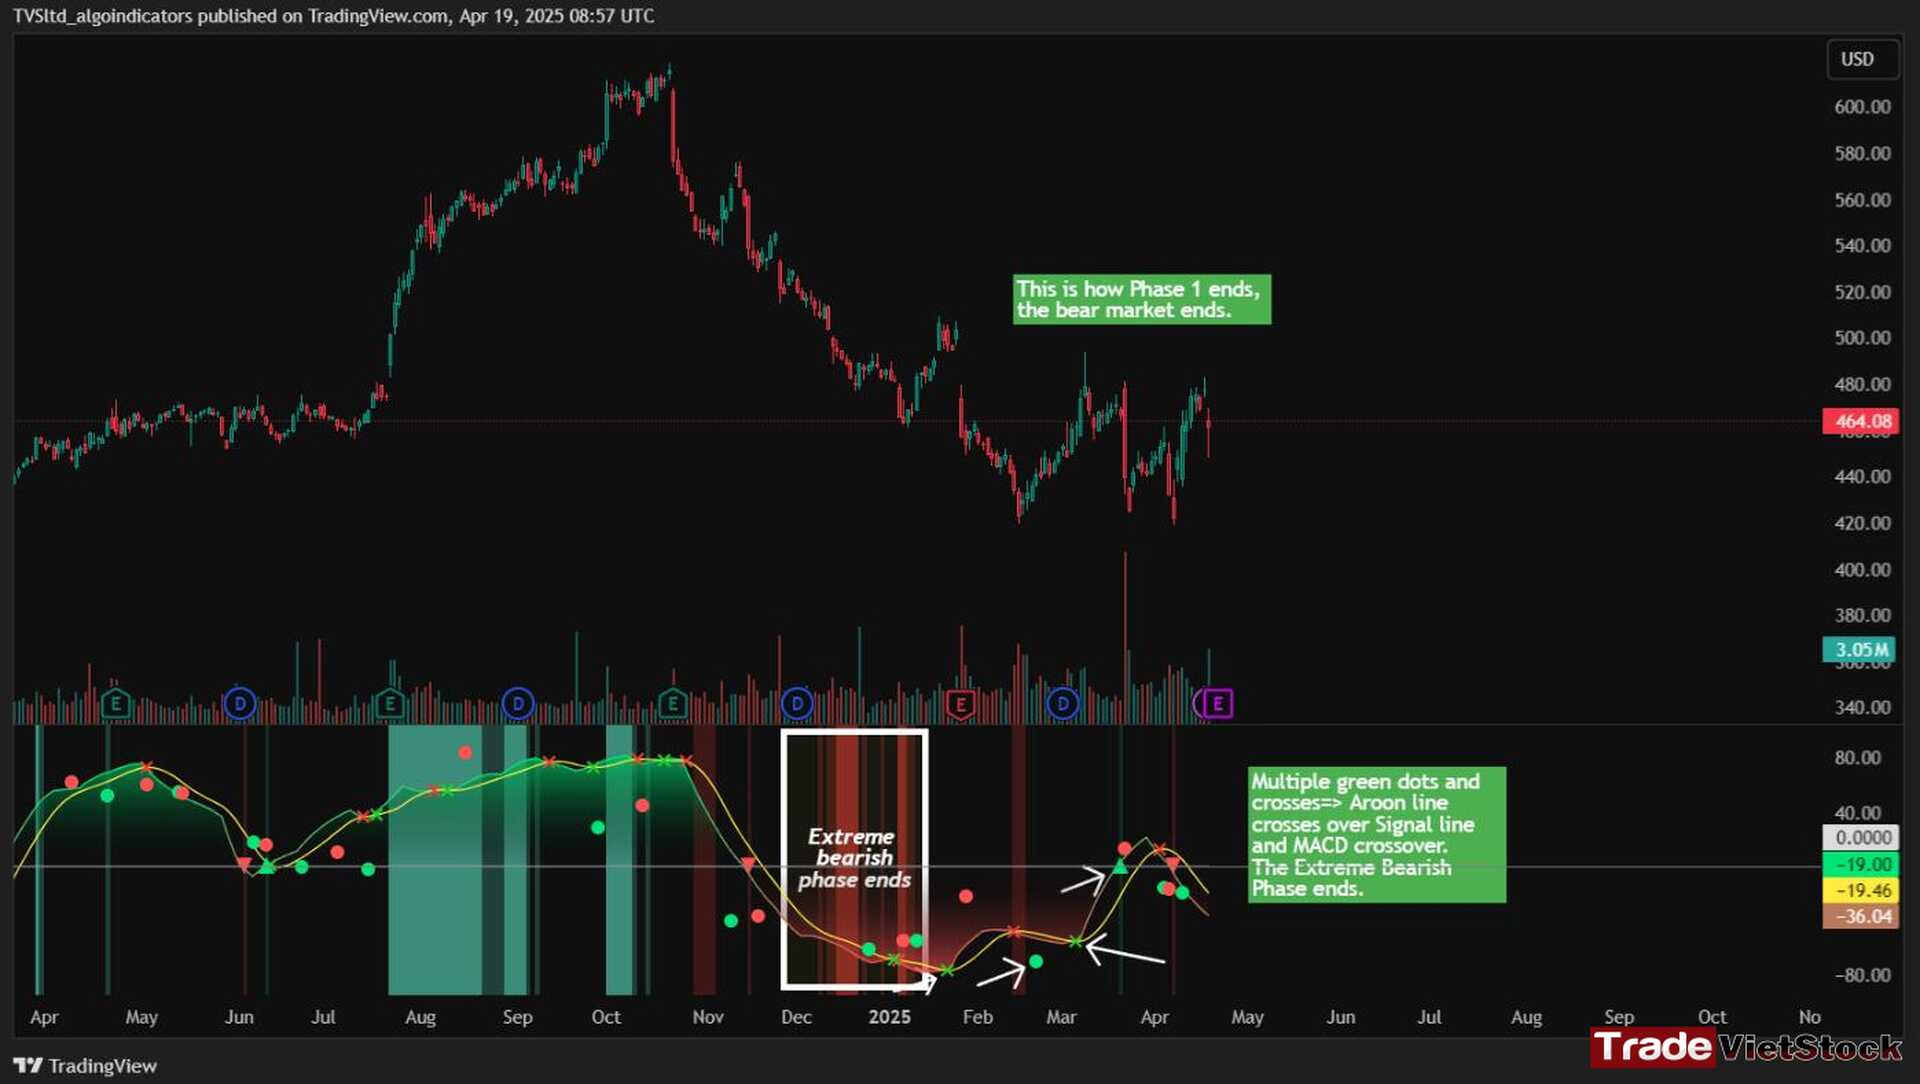
For example, consider LMT stock: after a 50% rise, Quantum Flux shows a green background, indicating an ‘Extreme Bullish Phase.’ Once this bullish phase ends, it sets the stage for a valid Phase 1, marking the start of the Bear Market.
The stock price drops sharply, causing Quantum Flux to show a red background as the Aroon line crosses below the signal line.
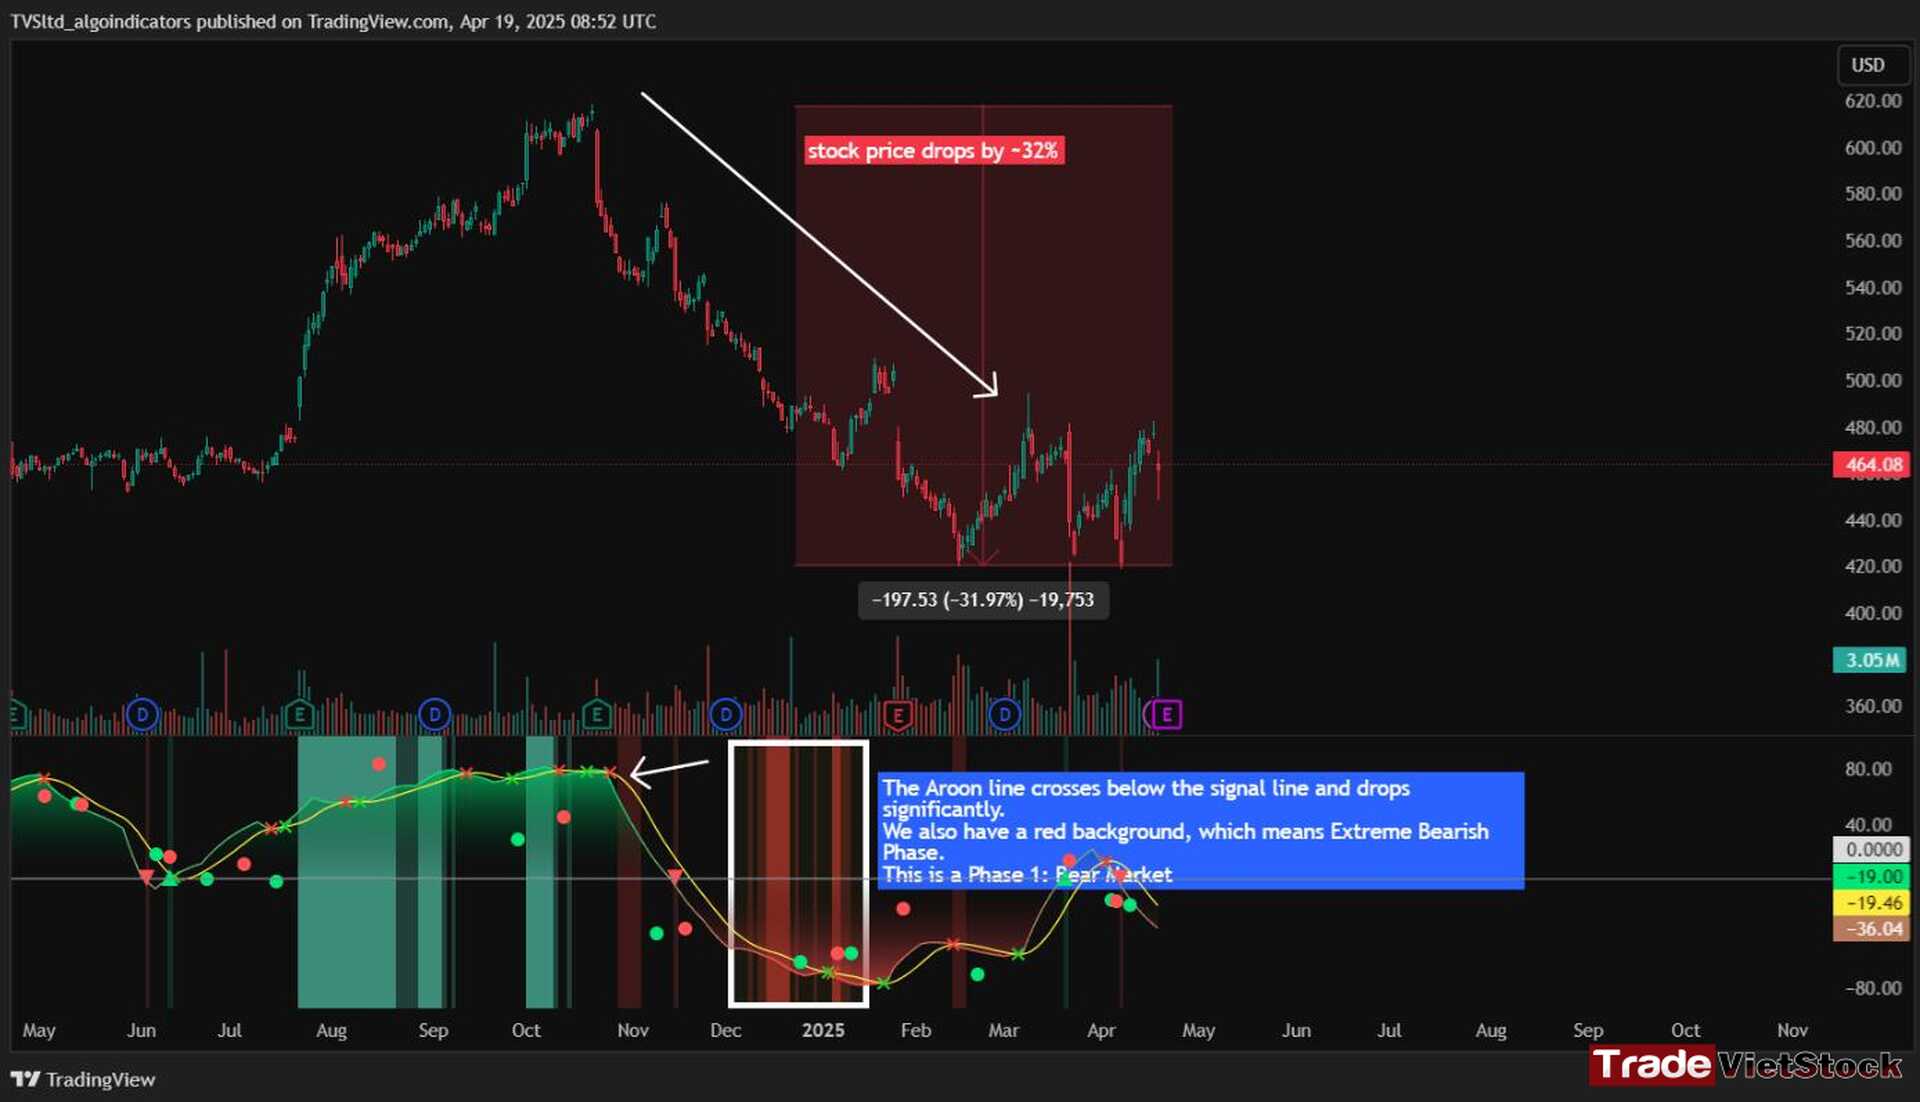
Phase 1 ends when we see several crossover signals, particularly when the Aroon line crosses above the Signal line. At this point, the red background, indicating the Extreme Bearish Phase, fades away. Let’s take a look at the image below:
Now, let’s move on to Phase 2: The Recovery. This phase comes after the Bear Market (Phase 1). Following a significant decline in stock price, a recovery or pullback is anticipated.
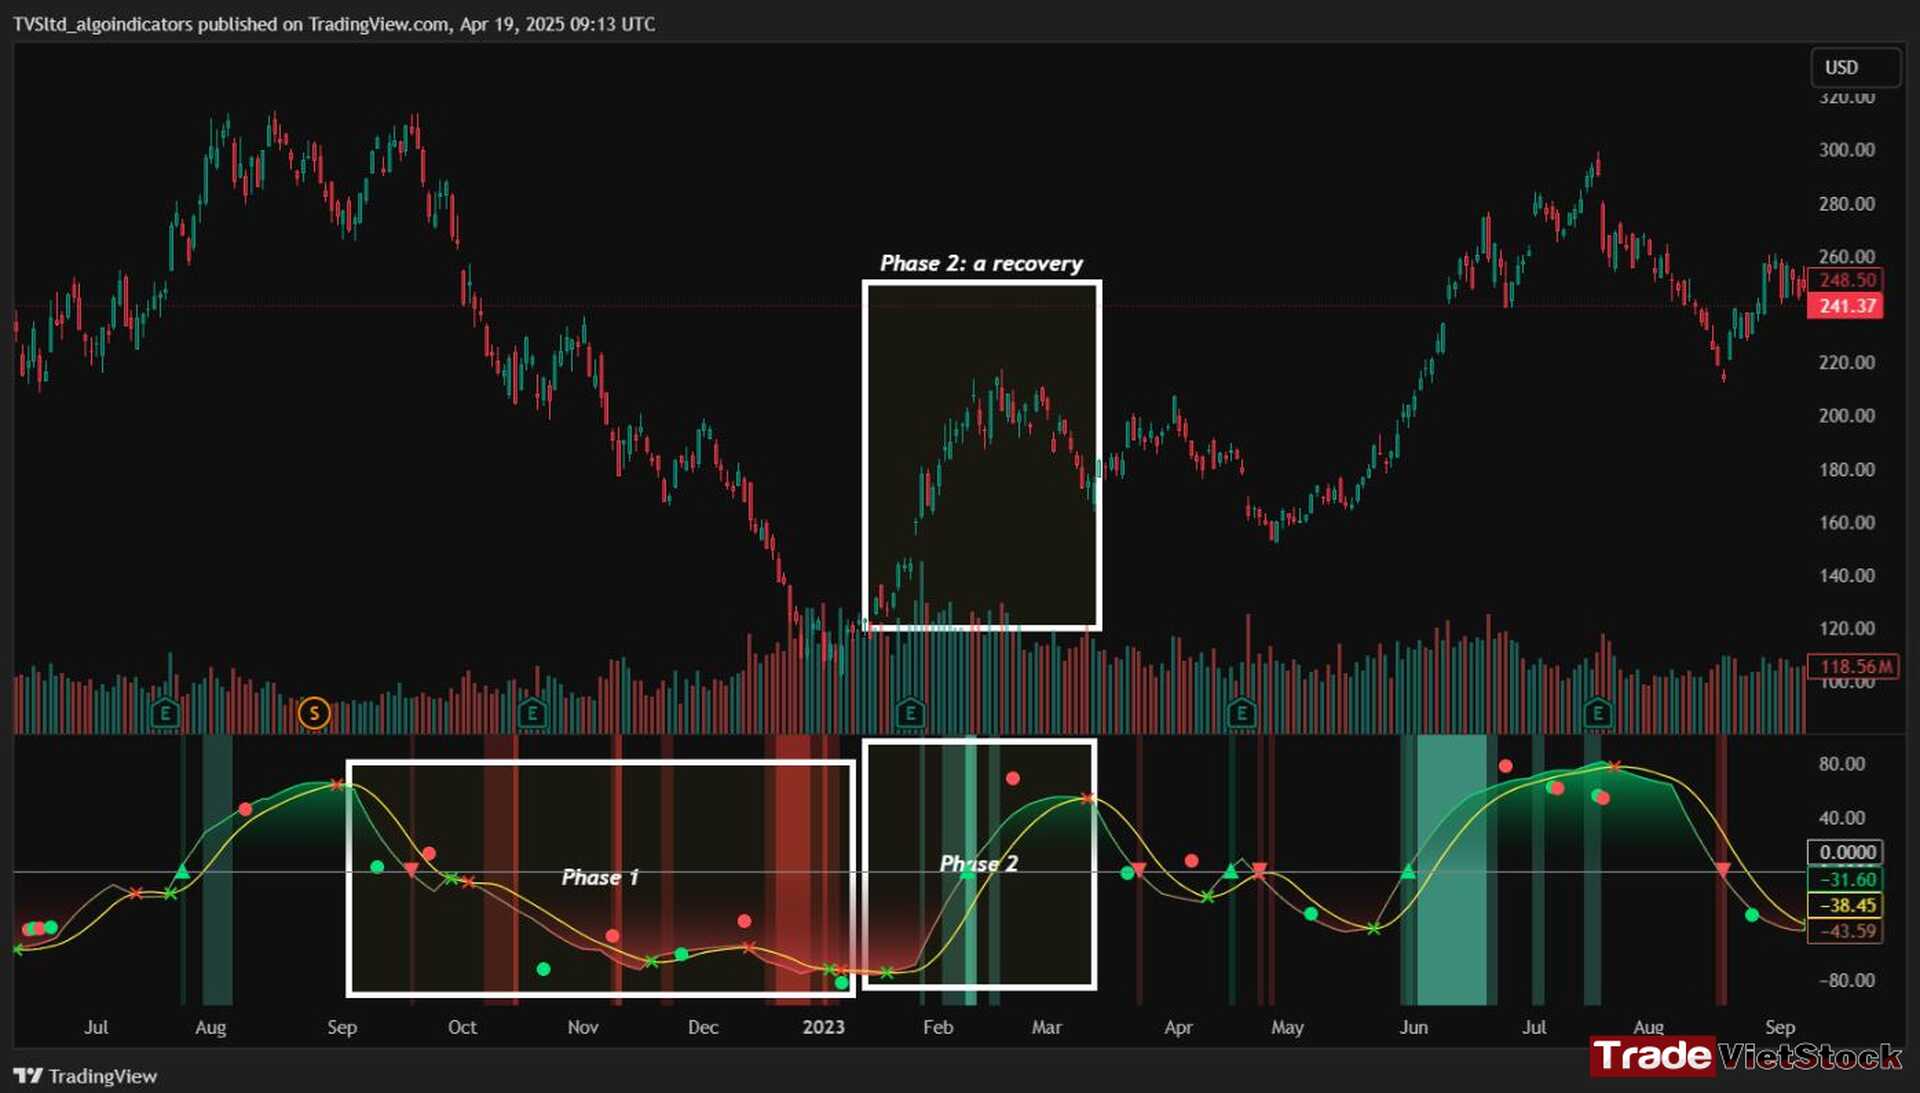
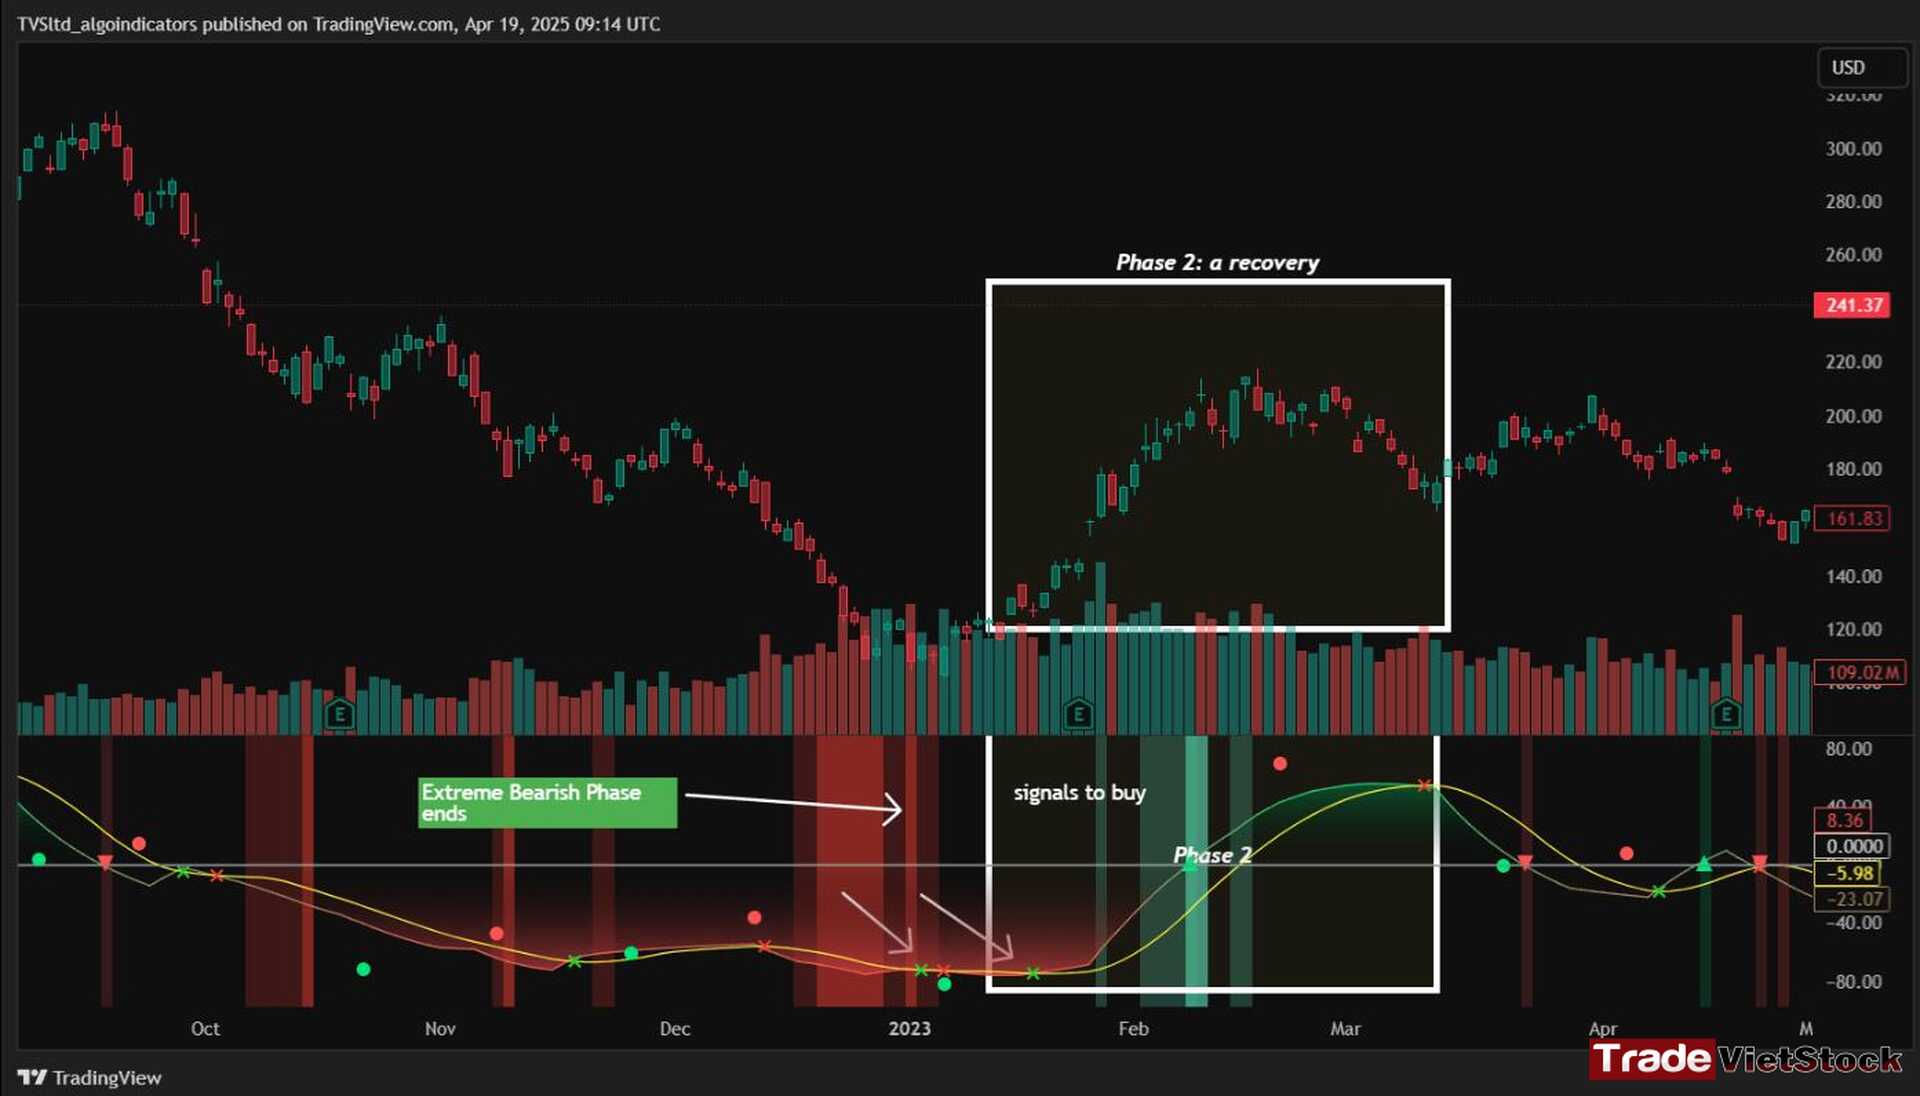
The signals for this phase include green dots and crosses, along with confirmation signals that indicate the end of Phase 1. Together, these provide valid Buy signals and present opportunities for mid-term investment strategies.
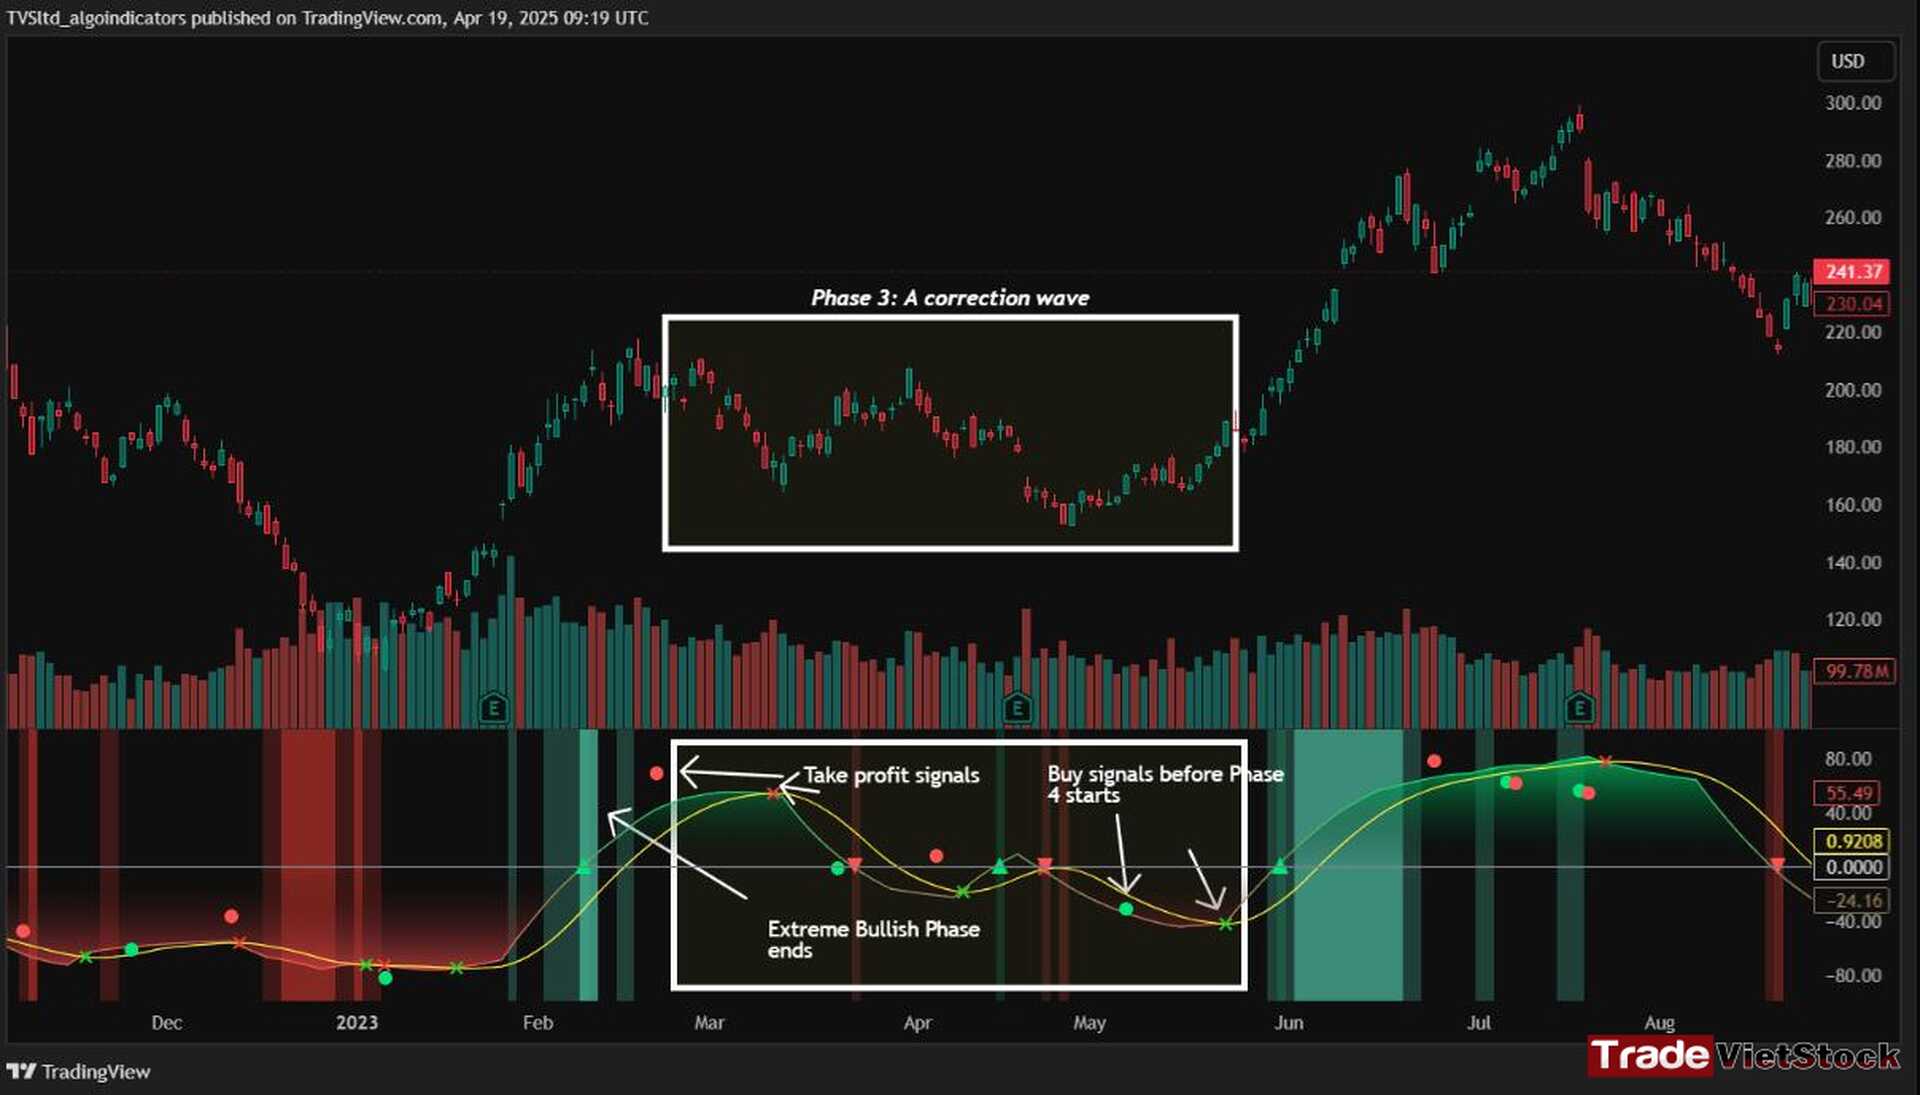
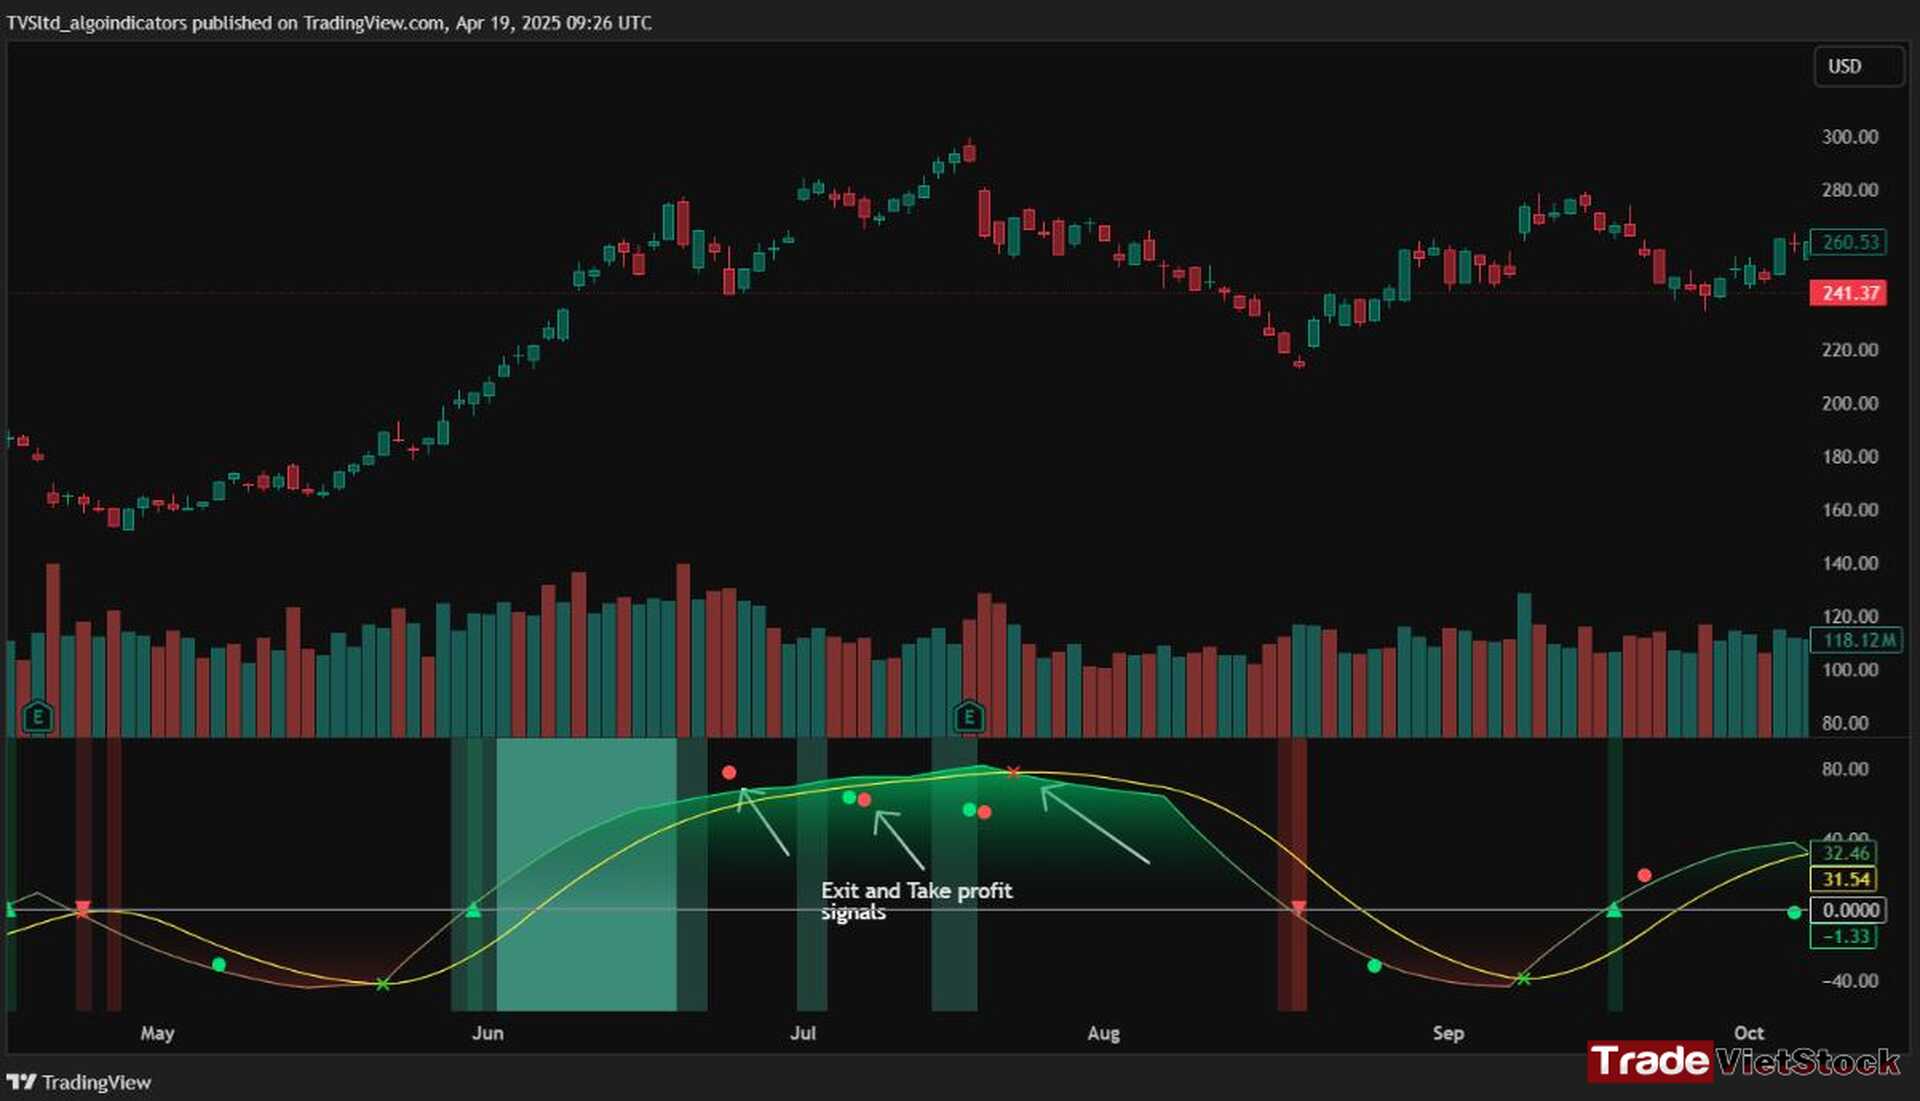
Phase 3 is the correction wave that follows the recovery. During this phase, we continue to use the cross and dot signals. In Phase 2, the strategy involves preparing to sell or take profits once the recovery phase reaches its peak. Red dots or red crosses indicate that it’s time to consider taking profits, signaling the potential end of the upward movement.
In Phase 3, the correction wave, the main goal is to take profits before the price begins to decline. This phase represents a temporary pullback following the recovery. Importantly, the end of Phase 3 often presents a strong buying opportunity, just before Phase 4, the strongest bullish wave, begins. When green dots and crosses appear at this stage, they act as clear Buy signals, allowing us to position early for the upcoming bullish momentum.
Phase 4 is the strongest bullish wave, and it’s one that investors definitely don’t want to miss. After entering at the end of Phase 3, the goal in Phase 4 is to maximize gains by targeting the highest highs.
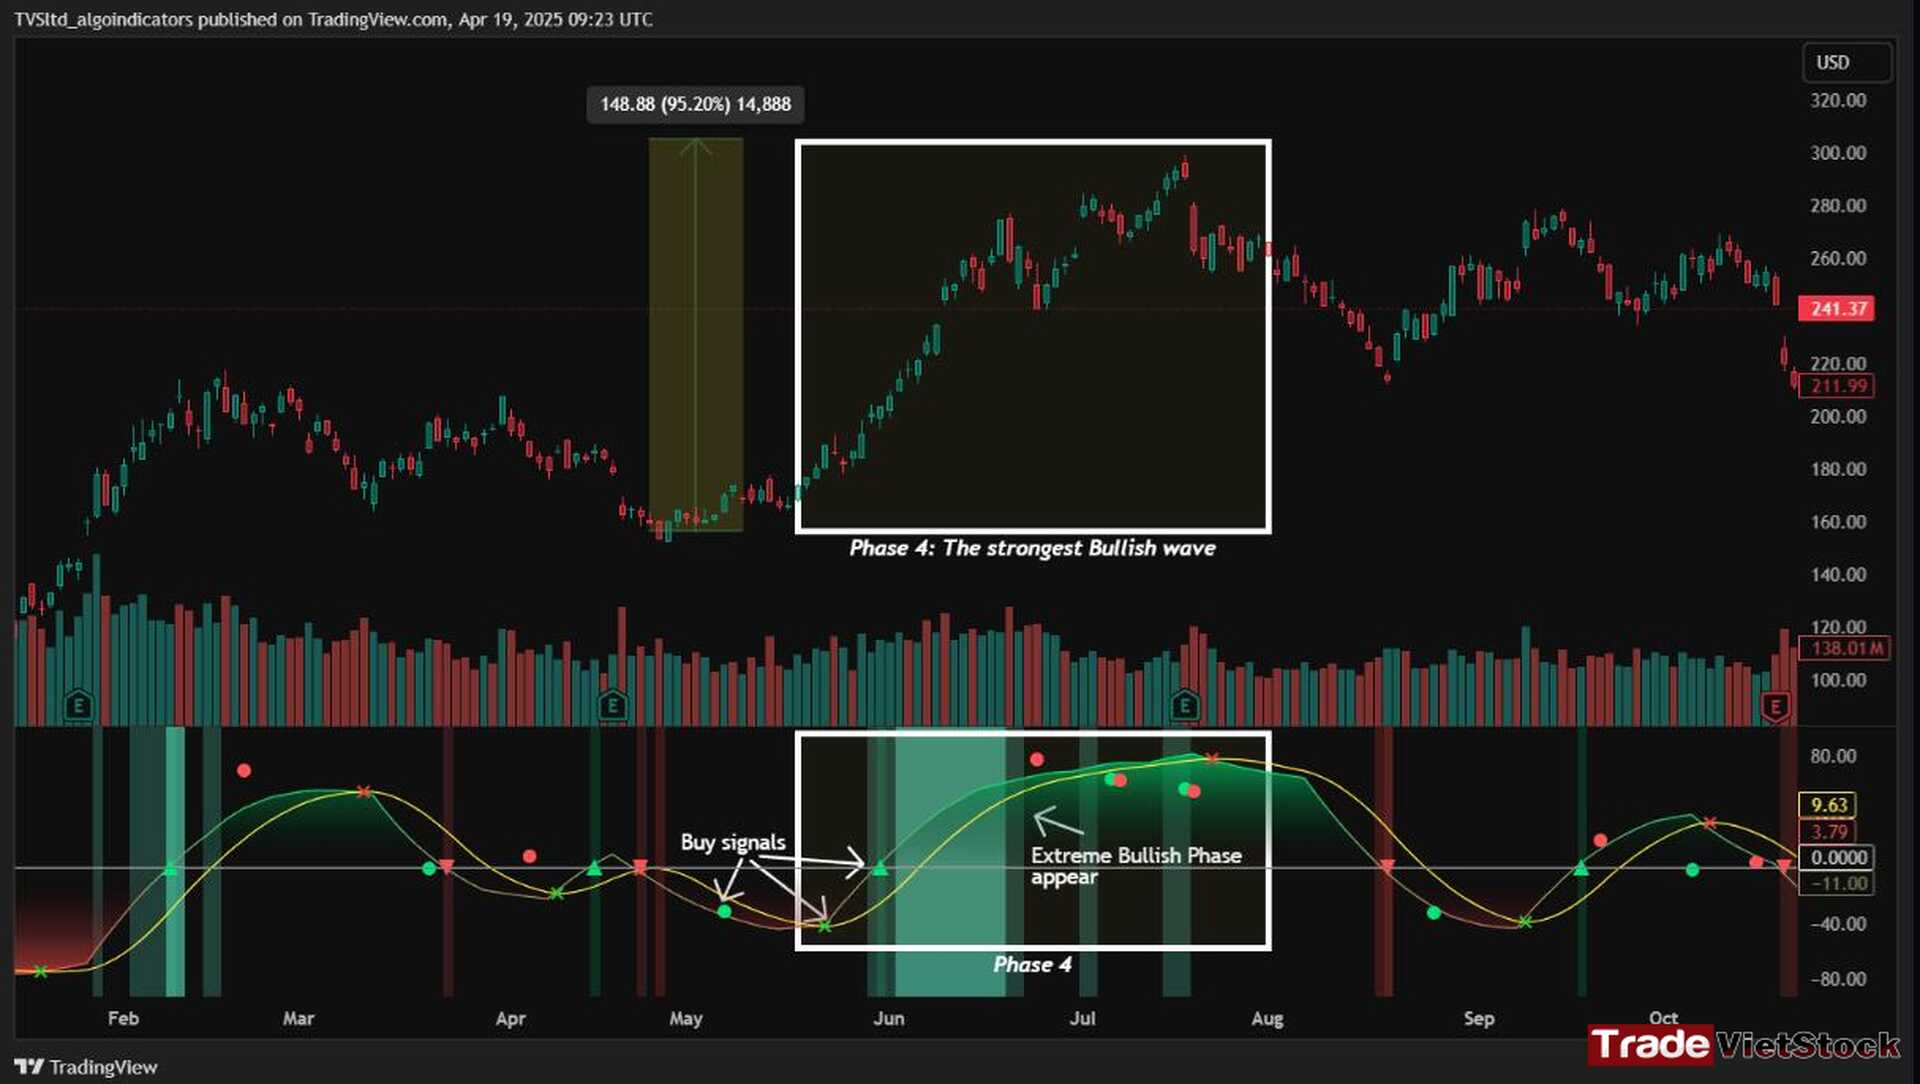
During this phase, we closely monitor our exit signals, which include the appearance of red dots and red crosses, as well as the disappearance of the Extreme Bullish Phase indicator (green background). These signals help us lock in profits at the peak of the bullish momentum.
iii. Conclusion
In summary, a market cycle consists of four stages: a bear market, a recovery phase, a correction wave, and a bull market. We buy at the end of Phase 1 (the bear market) and Phase 3 (the correction wave), or at the beginning of Phase 2 and Phase 4. The key is to buy at discounted prices—avoiding the FOMO (Fear of Missing Out) and not waiting for the price to soar before making a move.
I hope that the information in this Trade with market cycles article will help you begin your investment journey smoothly and with more confidence. Wishing everyone successful investments and profits!
We have our fan page on Facebook for Forex CFDs trading signals and analysis for every week, you can check this out: [HERE]
Furthermore, if you want real-time signals everyday, you can check out our small Investment and Trading community on Telegram: [HERE]
Don’t forget to follow this Investment and Trading Signal for free investment analysis and trading crypto and forex CFDs signals.
I know trading isn’t an easy game, especially for those who take it seriously. That’s why I believe you should practice consistently before finding the trading strategies that suit you best. You can start risk-free by opening a demo FX account to get familiar with the market.
Below are registration links for two of the best brokers:
- XTB Online Trading — the top broker for traders in the EU
- Exness — the best choice for traders in Asia
You can also experience world-class services and trusted reputations from some of the top 5 crypto exchanges:
- Binance — The largest crypto exchange on Earth
- Bybit — A well-established name known for its long-standing reputation and diverse financial instruments
- Bitget — User-friendly interface combined with a strong reputation
- MEXC — The lowest trading fees with one of the most beginner-friendly interfaces
- OKX — A major name known for secure asset storage and powerful DEX tools


 Tiếng Việt


