Automated trading strategy for Gold – Capture the big trend and earn
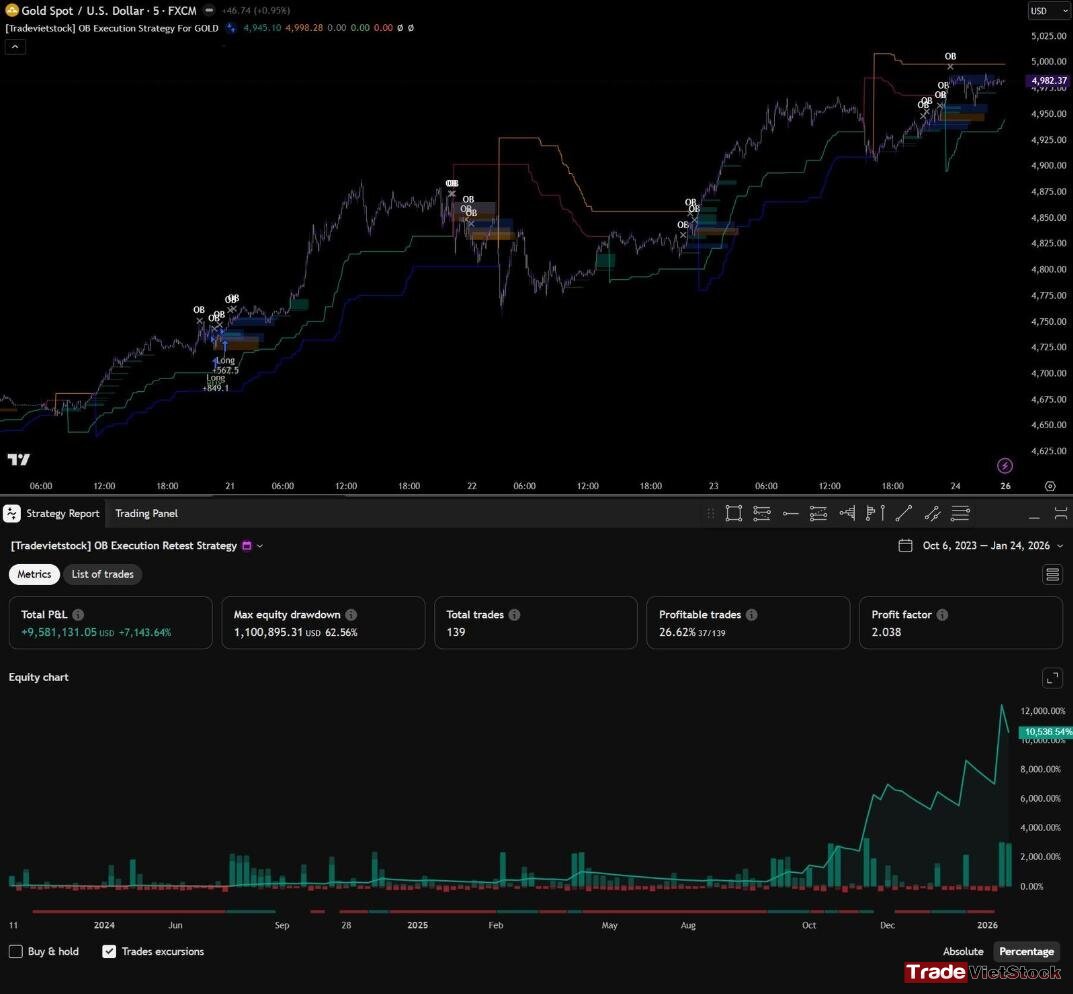
This automated trading strategy for Gold (XAUUSD) is a high-performance Institutional Trend-Following system designed specifically for the volatility of the Gold market. Backtest results over 10 years show exeptional performance, ranging from +6,545% to over 17,000% return, demonstrating the system’s ability to capture massive macro-trend extensions while filtering out market noise.
Automated Trading Strategy For Gold – Automated trading strategy for Gold (Tradevietstock_CP)
1. Identify the Primary Trend and Trade in One Direction Only
Unlike many automated gold trading strategies that frequently adapt to short-term market fluctuations, our system trades exclusively in the direction of the primary trend. While this approach may appear less flexible, we believe that for Gold (XAUUSD), aligning with the dominant “macro wave” is what maximizes returns while minimizing risk.
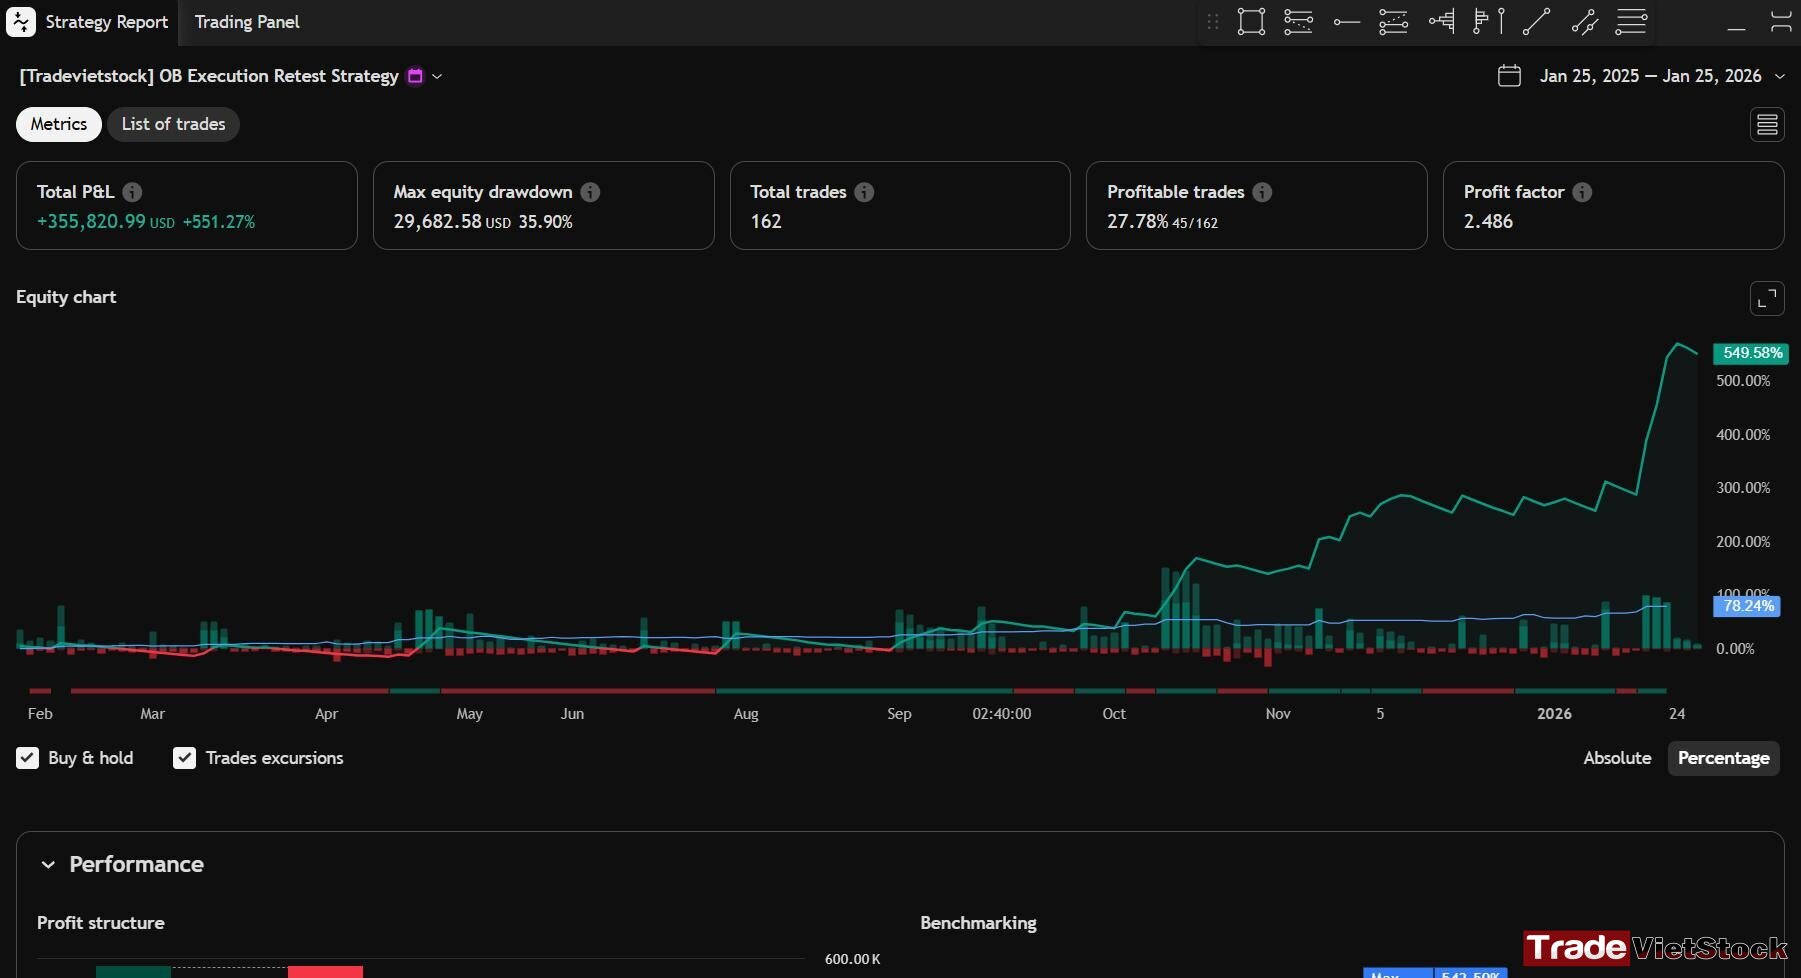
For example, since 2024, after the Tradevietstock Automated Trading Strategy for Gold identified a sustained uptrend in XAUUSD, it has generated long (buy) signals only. During this period, the strategy achieved an overall return of over 450%, depending on the selected risk per trade (in the illustrated example, risk per trade is limited to just 2%).
Throughout this phase, gold prices have trended strongly upward, with no meaningful bearish reversals—only minor pullbacks that presented improved long-entry opportunities. Attempting to sell during this environment would likely result in losses, and even profitable short trades would yield insignificant gains compared to the returns generated by the dominant bullish waves. Moreover, the risk associated with short positions during such periods is disproportionately high.
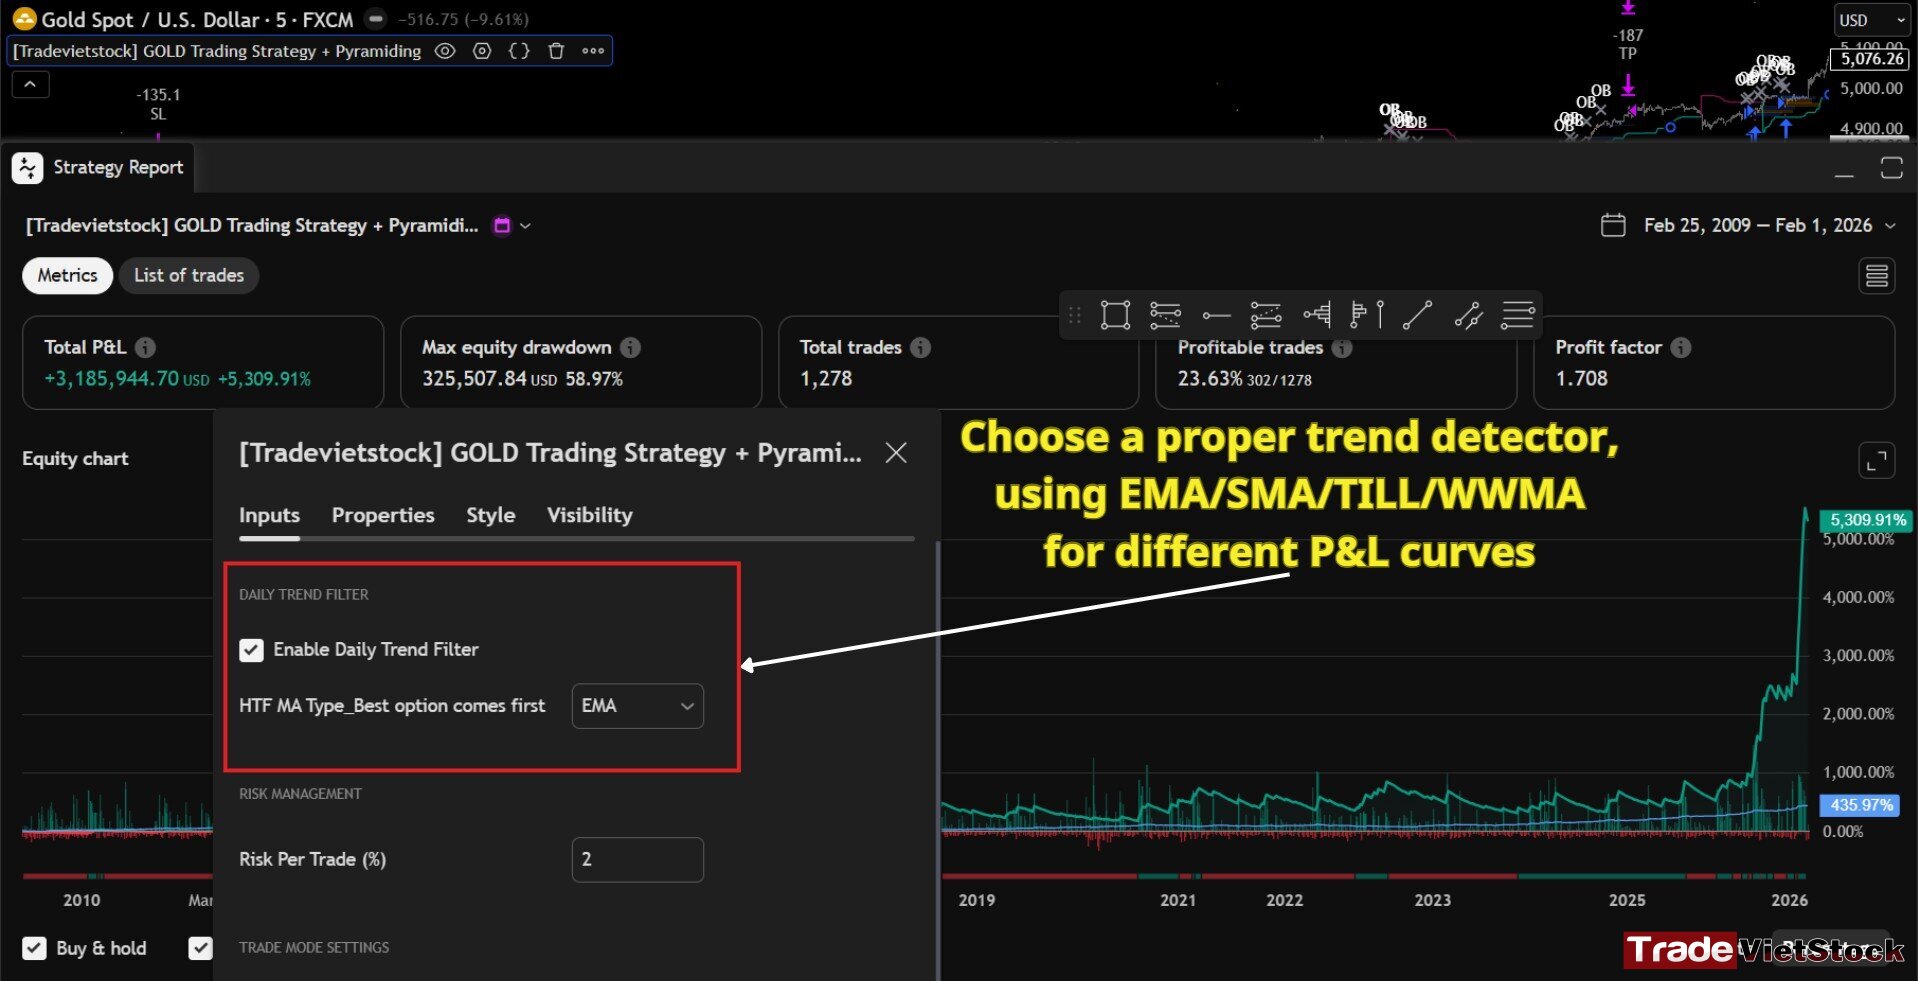
You can also select different methods to detect the primary market trend, including EMA, SMA, WWMA, and TILL. These indicators serve as the core trend-detection mechanisms of the strategy. It is important to note that each method produces a different P&L curve, reflecting varying risk and return characteristics.
Choose A Proper Trend Detector For Different P&l Curves
Over long-term horizons, EMA-based trend detection has historically delivered the highest overall returns. In contrast, over shorter periods—such as one year—TILL or WWMA tend to perform better, offering smoother equity curves and faster responsiveness to market changes.
Ultimately, the choice of trend-detection method depends on your preferred risk–reward profile and risk management strategy.
Note: The Automated Trading Strategy for Gold automatically identifies the prevailing market trend and generates corresponding long or short signals. You simply execute trades according to the signals provided—no manual trend analysis is required.
2. Asymmetric Risk Management
The strategy’s characteristic “hockey stick” equity curve is the result of asymmetric risk–reward dynamics.
Small Losses, Large Wins:
As reflected in the performance metrics, the win rate is approximately 24.88%, meaning the strategy experiences more losing trades than winning ones. However, winning trades are significantly larger—often 4x to 11x the size of a loss. This imbalance allows the account to grow exponentially over time despite a relatively low win rate.
Dynamic Position Sizing:
Position size is calculated automatically based on a fixed percentage of account equity (typically 2%–5%, depending on user settings). This ensures that no single trade—or even a sequence of losses—can cause catastrophic damage to the account.
3. Performance Over 10 Years
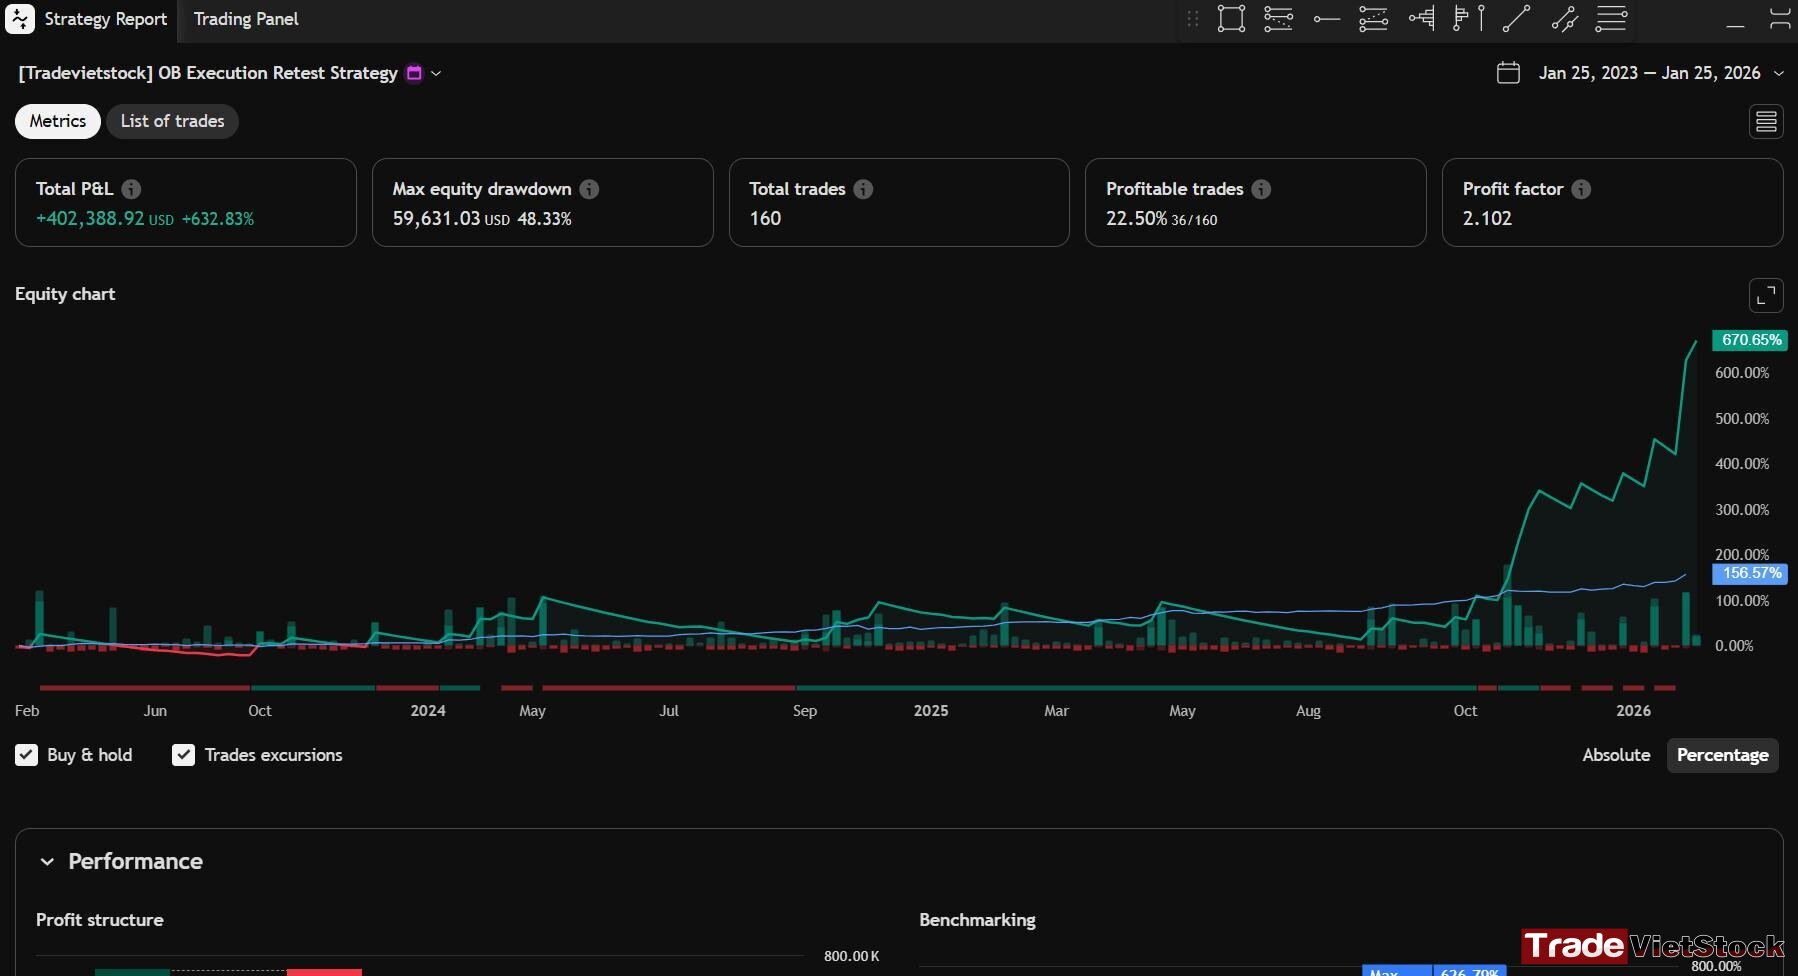
As illustrated in the image below, since 2023, the strategy has achieved an overall return of over 670%, using only 160 trades during this period. Although the win rate remains just above 22%, the high reward-to-risk ratio more than compensates for the losses, resulting in strong net profitability.
Total P&l And Growth Of A Gold Trading Strategy Since 2023 – Automated trading strategy for Gold (Tradevietstock_CP)
Users can also adjust the reward-to-risk parameters. In the default configuration, the strategy uses a reward-to-risk ratio of 20:1 for long positions, and 4:1, 5:1, or 6:1 for short positions, depending on market conditions.
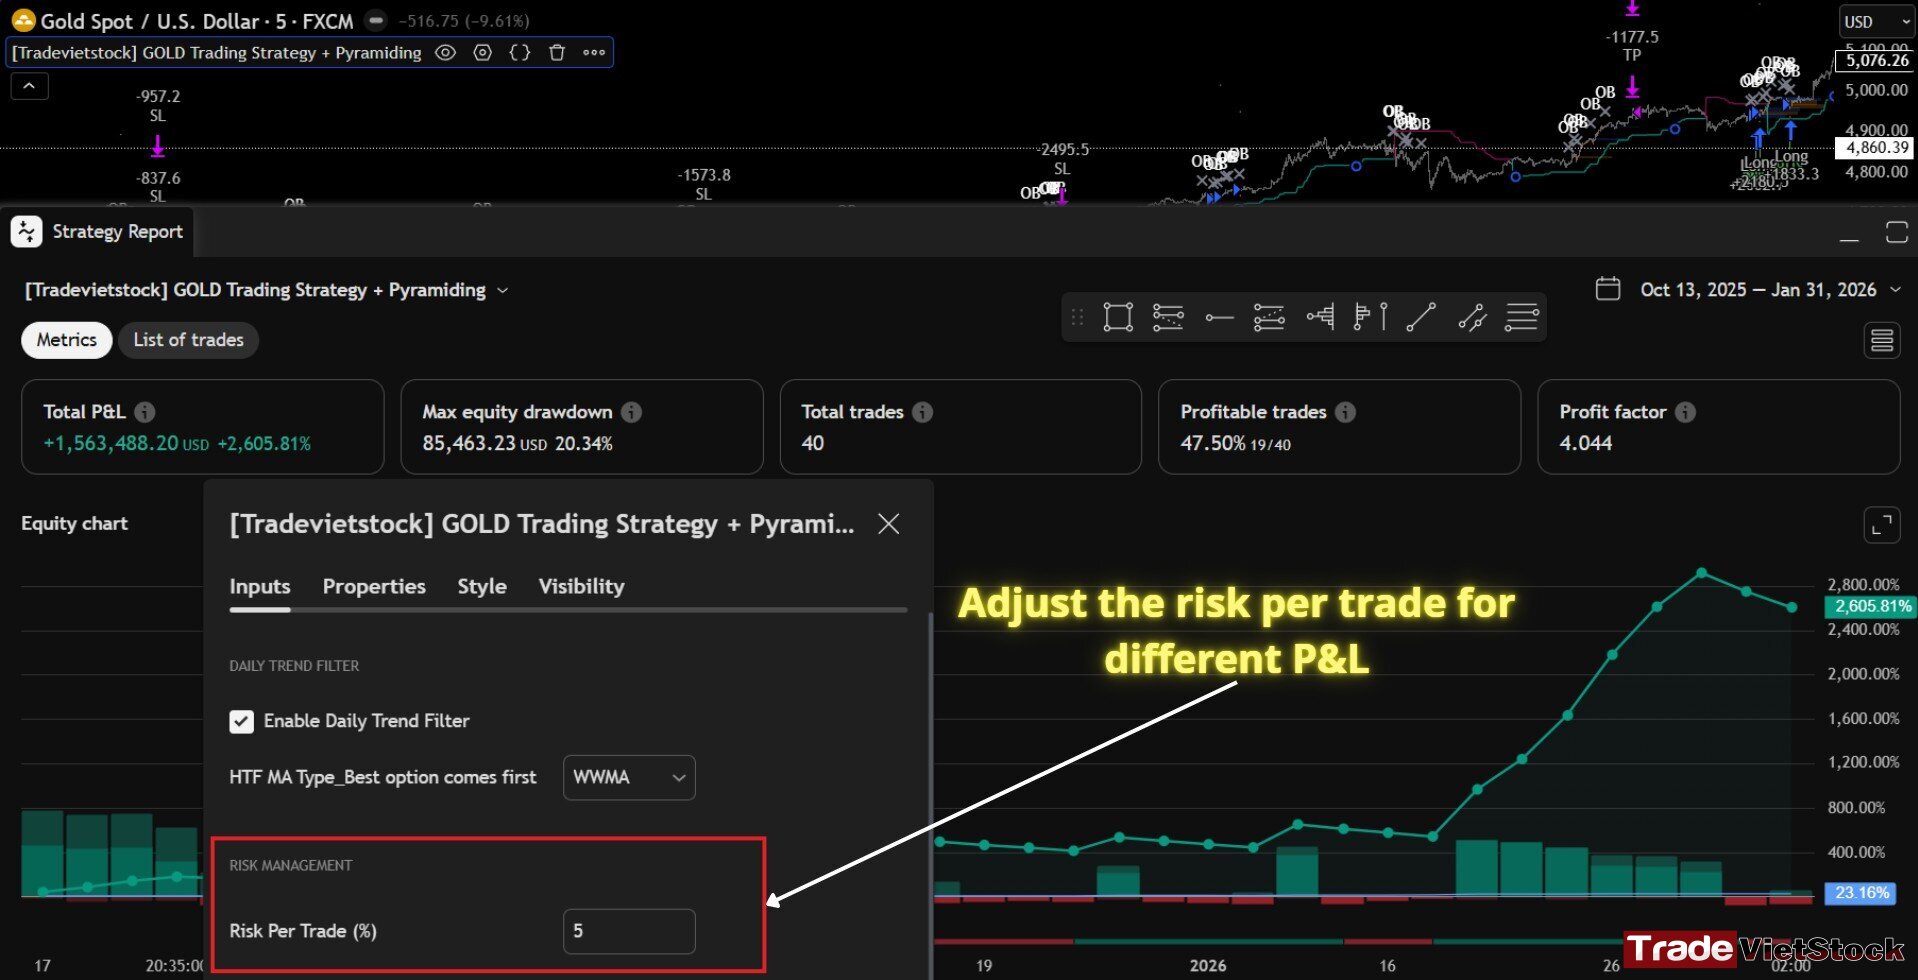
In addition, it is crucial to adjust the risk per trade (%) according to your overall risk management approach. For prop firm accounts, where drawdown limits are strict despite large capital allocations, a conservative risk of 0.1%–0.2% per trade is recommended. For personal accounts, a higher risk range of 2%–5% per trade may be appropriate.
Adjust Risk Per Trade For Different P&l Curves – Automated trading strategy for Gold (Tradevietstock_CP)
4. Summary of Performance
These are some samples and proofs of Automated Trading Strategy For GOLD’s performance:
Impressive Growth Relative To Adjusted Risk Per Trade – Automated trading strategy for Gold (Tradevietstock_CP)
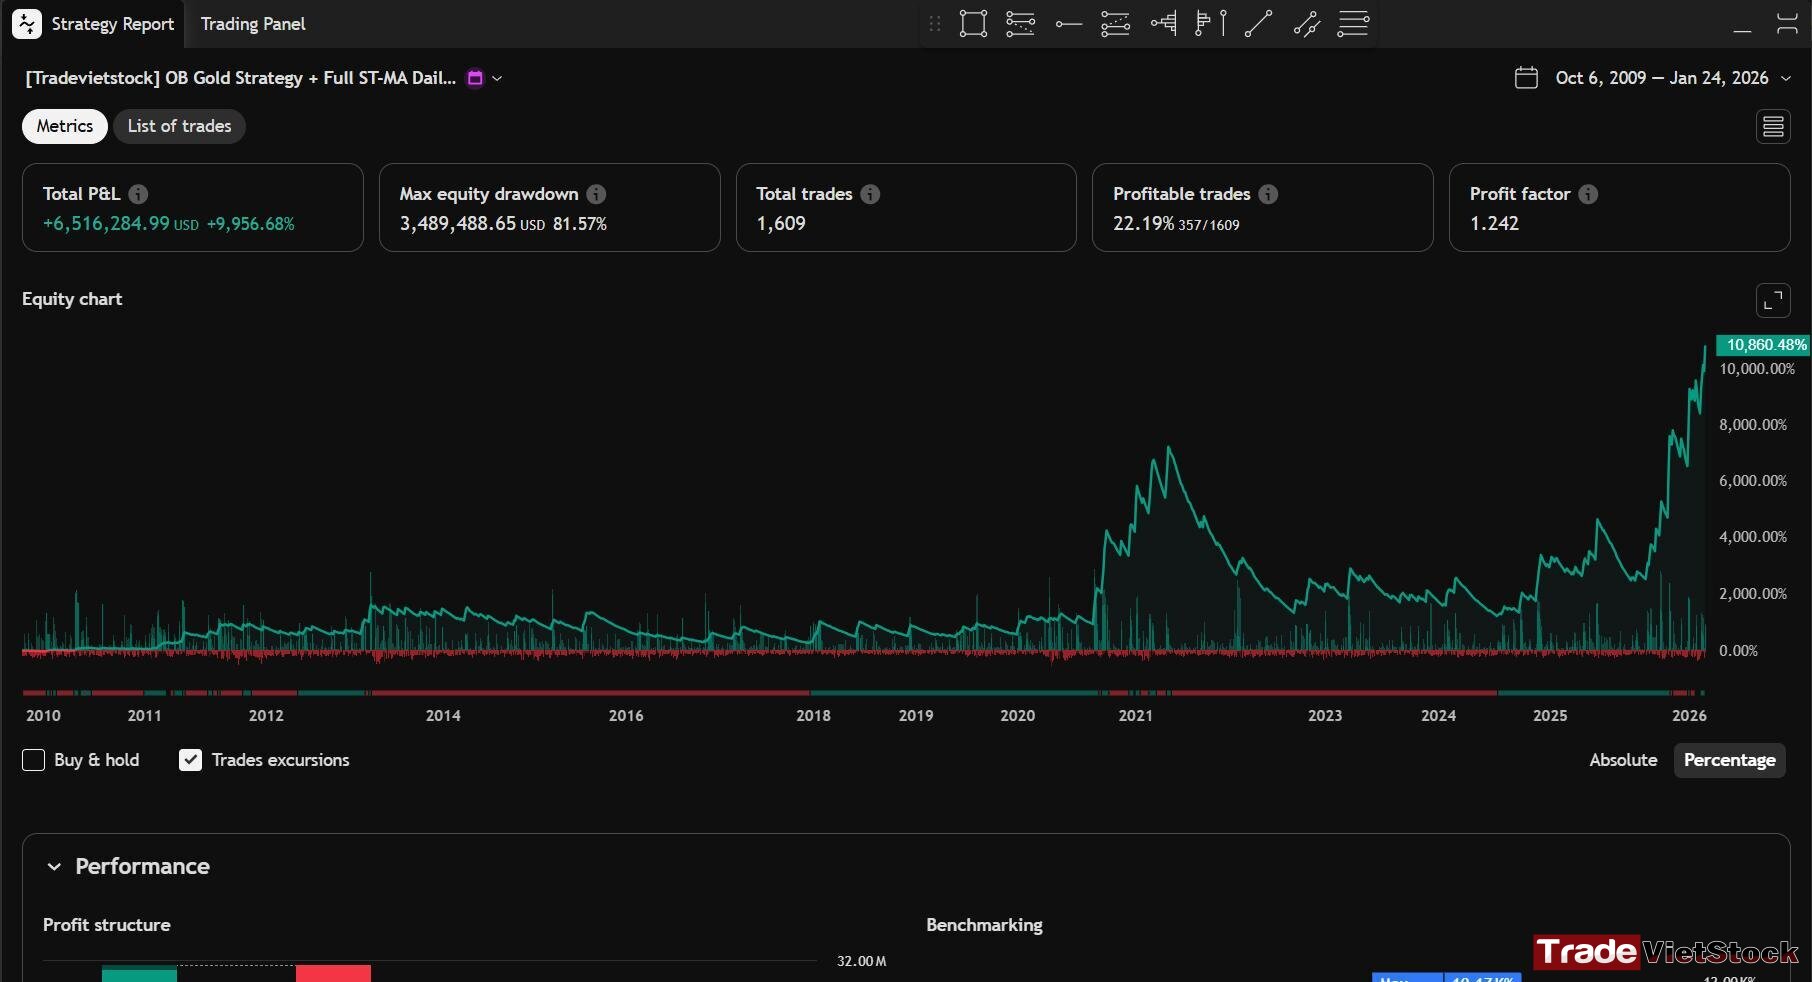
Depending on the selected risk management settings, the strategy can produce varying levels of total P&L, each associated with a different maximum drawdown. However, the win rate remains largely stable, consistently hovering around 22%, regardless of parameter adjustments. In the image below, it produce 10,860.48% in return since 2009.
Total P&l And 10-year Growth Of A Gold Trading Strategy (minor Parameter Adjustments) – Automated trading strategy for Gold (Tradevietstock_CP)
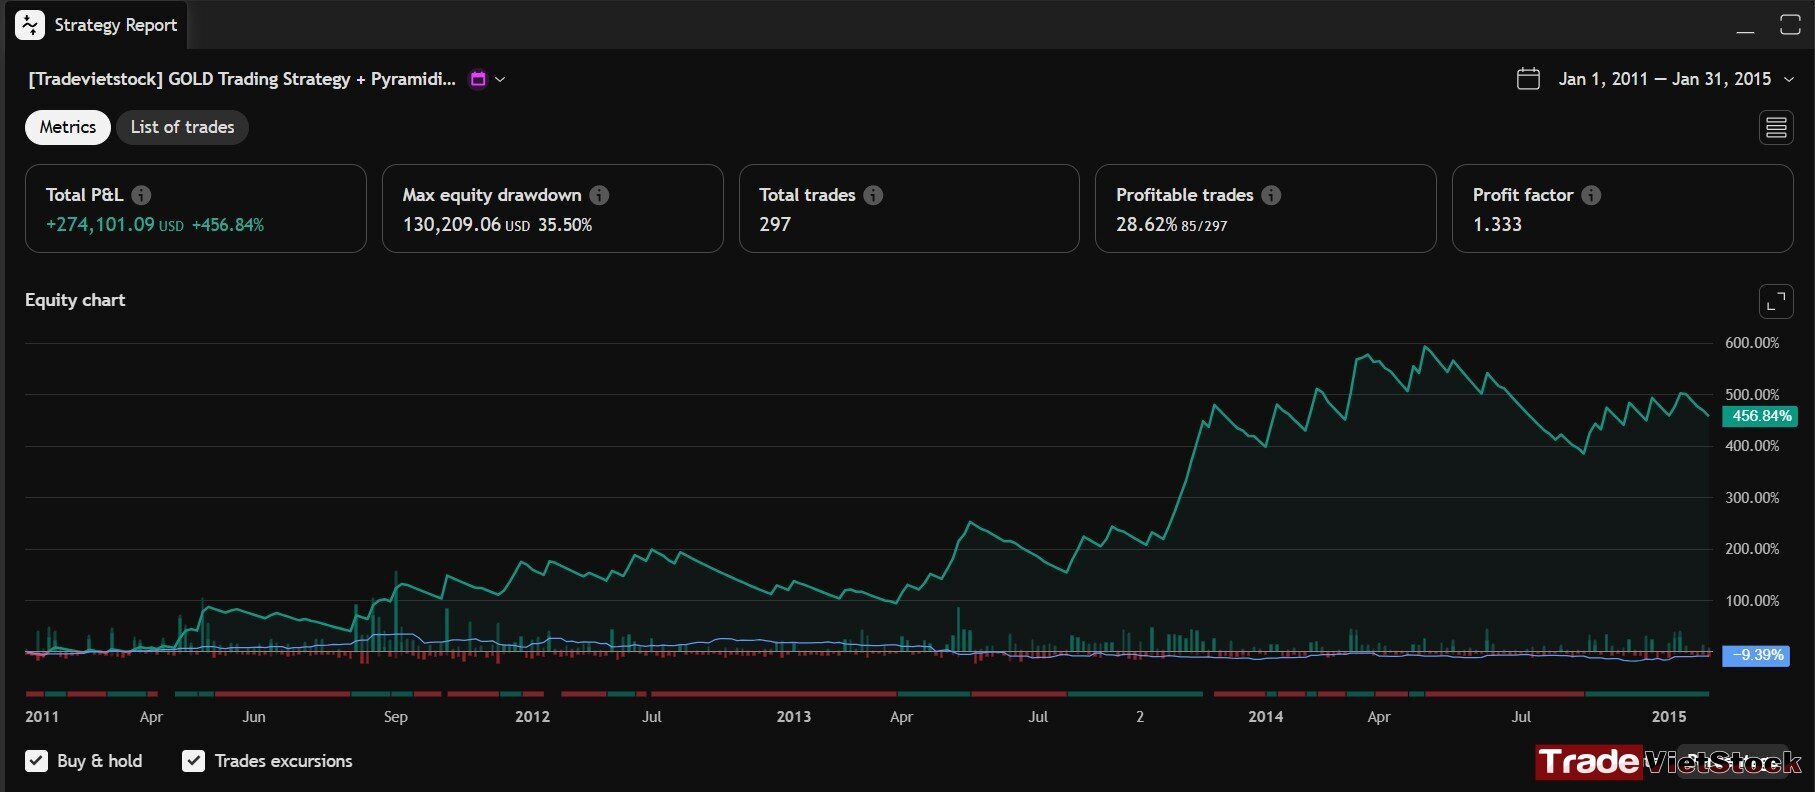
Even during prolonged bearish cycles in the gold market, the strategy continues to perform effectively. From 2010 to 2015, a period characterized by sustained downside pressure in gold, the system still generated a total return of 456.84% over more than four years.
Total P&l Of The Automated Trading Strategy For Gold In Bearish Cycle From 2011 To 2015 – Automated trading strategy for Gold (Tradevietstock_CP)
Some statistics you should know about this strategy:
Total P&L over 10 years: 17 661.8%
Total P&L during bearish cycle from 2011 to 2015: 456%


 Tiếng Việt
Candy –
Just bought it. Can’t wait to see signals triggered.
The backtest result is fire btw