Capital management in trading
| Date: 28/06/2025 | 422 Views | Investment and Trading Academy |
Capital Management in Trading and Investing – Stock, Crypto, and CFD Trading
We’ll explore several position sizing and strategies for capital management in trading, including Fixed Fractional Position Sizing, the Kelly Criterion, and Pyramiding. These are among the techniques that Tradevietstock has consistently applied throughout its investment and trading activities.
It’s important to understand that no matter how excellent your trading strategy may be, if your capital management approach is careless or poorly structured, sooner or later you will end up blowing your account.
For example, imagine you have a trading strategy with a 99% win rate, meaning you win 99 out of 100 trades. But if on that 100th trade you go all-in and lose, your entire account — and all the effort from those previous 99 trades — will be wiped out. That’s why proper money management in investing and trading is critical in any market, whether it’s stocks, forex, or crypto.
i. Fixed Fractional Position Sizing
1. Definition
Fixed Fractional Position Sizing is a capital management method where a fixed percentage of your total investment capital is allocated to each trade. This is one of the most popular and beginner-friendly position sizing techniques in trading.
Instead of risking a fixed dollar amount on each trade, you risk a fixed percentage of your account balance, typically ranging from 1% to 5%, depending on your personal risk tolerance. For funded traders, this percentage is often lower, around 0.2%, due to strict maximum drawdown rules imposed by prop firms and trading funds.
Key principles:
- Set a fixed risk percentage for each trade (for example, 0.2%–2% of your total account balance).
- Calculate the position size based on this risk amount and the distance from your entry price to your stop-loss level.
- Adjust your position size as your account balance increases or decreases.
For example:
Let’s say you have a $100,000 account, and you decide to risk 0.2% per trade.
- On your first trade, your risk amount would be:
$100,000 × 0.2% = $200
- If this trade results in a loss, your account balance drops to $99,800.
- On your next trade, your risk amount would now be:
$99,800 × 0.2% = $199.60
So the position size is continuously recalculated based on your current account balance, not your initial capital.
Adjusting your stop-loss level also directly affects your profits.
For example, if your Risk-Reward Ratio (R:R) is 4:1, it means that for every losing trade, you risk 0.2%, while for each winning trade, you earn 0.8%. This return is calculated based on your current account balance.
Since your stop-loss amount is set as a percentage of your account balance, this method creates a compounding growth effect if your trading performance remains consistently positive.
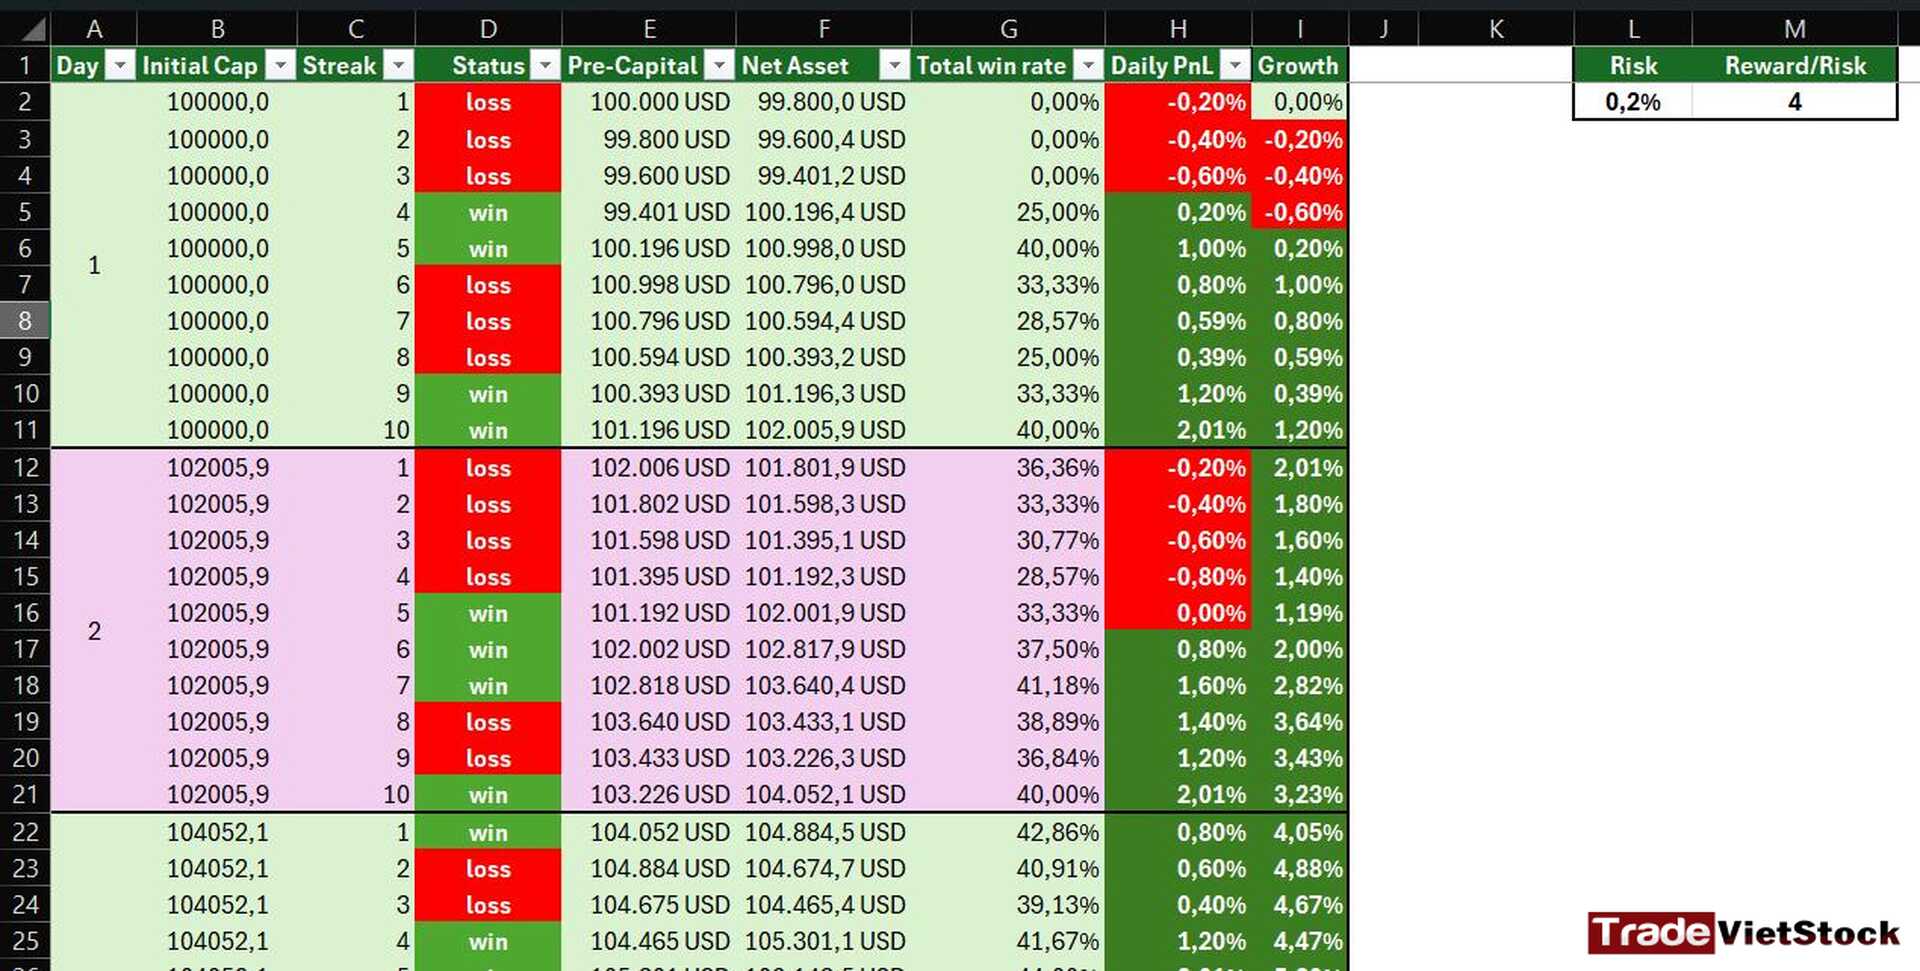
Capital management in trading and investing is crucial — it determines how much capital you allocate to each trade. It’s highly recommended to build a custom Excel file to calculate and manage your risk accordingly.
The example above is a sample Excel model.
If you’d like to receive a reference file, you can register a trading account using the panel on the left of your screen and contact the provided phone number to get the original Excel file — completely free of charge.
Advantages:
- Minimizes the risk of blowing your account by never risking too much on a single trade.
- Flexible and suitable for accounts of all sizes.
- Easy to apply, with no complicated calculations required.
- Generates attractive long-term growth thanks to compounding returns.
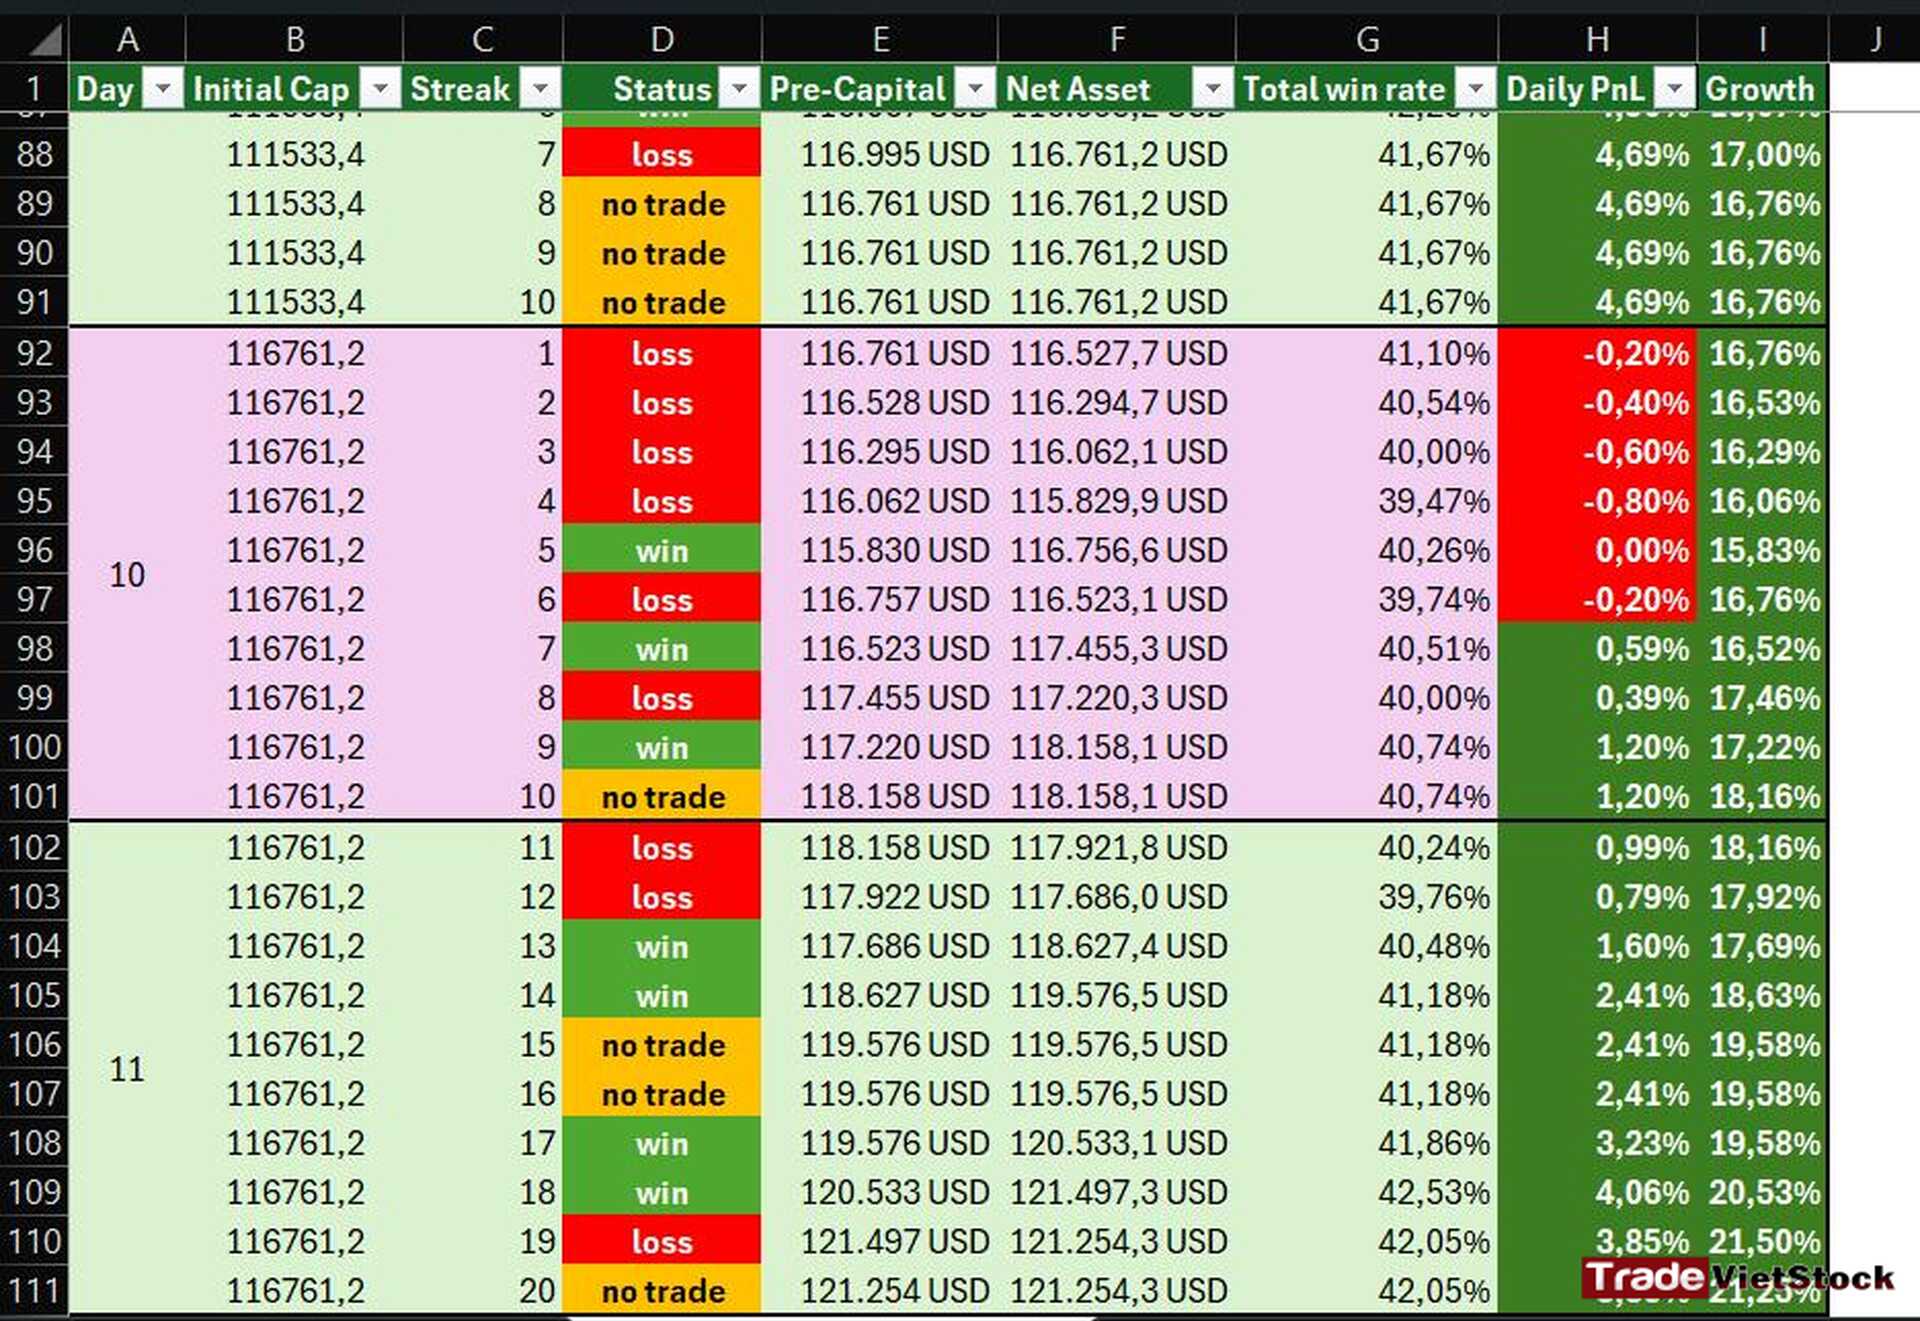
By the 11th trading day, using Fixed Fractional Position Sizing, your account could grow by 21.23% — even with a relatively modest win rate of around 42%.
Disadvantages:
- May limit your potential profits if your account balance is small and your risk percentage is too low.
This ultimately depends on your individual risk tolerance and the trading strategy you’re using.
- Requires strict discipline and consistency in adhering to your predefined risk percentage.
2. Simple Capital Management Table
If you want to build your own Fixed Fractional Position Sizing management table, below is a basic example to illustrate.
First, you need to set up a table for your own capital management in trading to track and calculate position sizes. Below is a sample with an account balance of 10,000 USD and a 2% risk rate:
| Account Balance (USD) | Risk per Trade (%) | Risk Amount (USD) | Stop-loss Distance (pips) | Position Size (lot) |
| 10,000 | 2 | 200 | 50 | 0.04 (Forex) |
| 9,500 | 2 | 190 | 50 | 0.038 (Forex) |
| 11,000 | 2 | 220 | 50 | 0.044 (Forex) |
How to calculate:
1️⃣ Risk per Trade
Risk Amount = Account Balance × Risk %
2️⃣ Position Size
Position Size = Risk Amount ÷ (Stop-loss % × Entry Price)
3️⃣ Required Leverage
Leverage = Position Size × Entry Price ÷ Account Balance
Example with a Bitcoin trade:
- Your current account balance is $50,000. You risk 1% per trade.
- A Long position with Entry = $110,000. Stop-loss = $109,000. Stop-loss distance = $1,000. Meaning when BTC drops 0.9%, you will stop out.
- R:R = 4, meaning you risk $1 to gain $4.
- Capital for the Long order is $500, meaning if you lose, you lose $500; if you win, you gain $2,000.
- Calculate Position Size: 500 ÷ 0.9% = 55,555
- At this point, you’ll need to use leverage because your account only has $50,000. Just divide position size by account balance: Leverage = 55,555 ÷ 50,000
ii. Pyramiding
1. Concept of the Method
Pyramiding is a trading strategy in which you continuously increase your position size as the asset price moves in your expected direction. This method is especially effective in a bullish market, helping to maximize profits while reducing risk in case the trend reverses.
The name “pyramiding” comes from the structure of the position: larger, safer positions are placed at the bottom, while smaller, higher-risk positions are added progressively at the top.
Key principles:
- Start with an initial position, then add new positions when the price increases (in an uptrend) or decreases (in a downtrend) and the trend is confirmed.
- Each new position is usually smaller than the previous one to control risk.
- Set stop-loss for each position to protect accumulated profits.
2. How It Works and Example Illustration
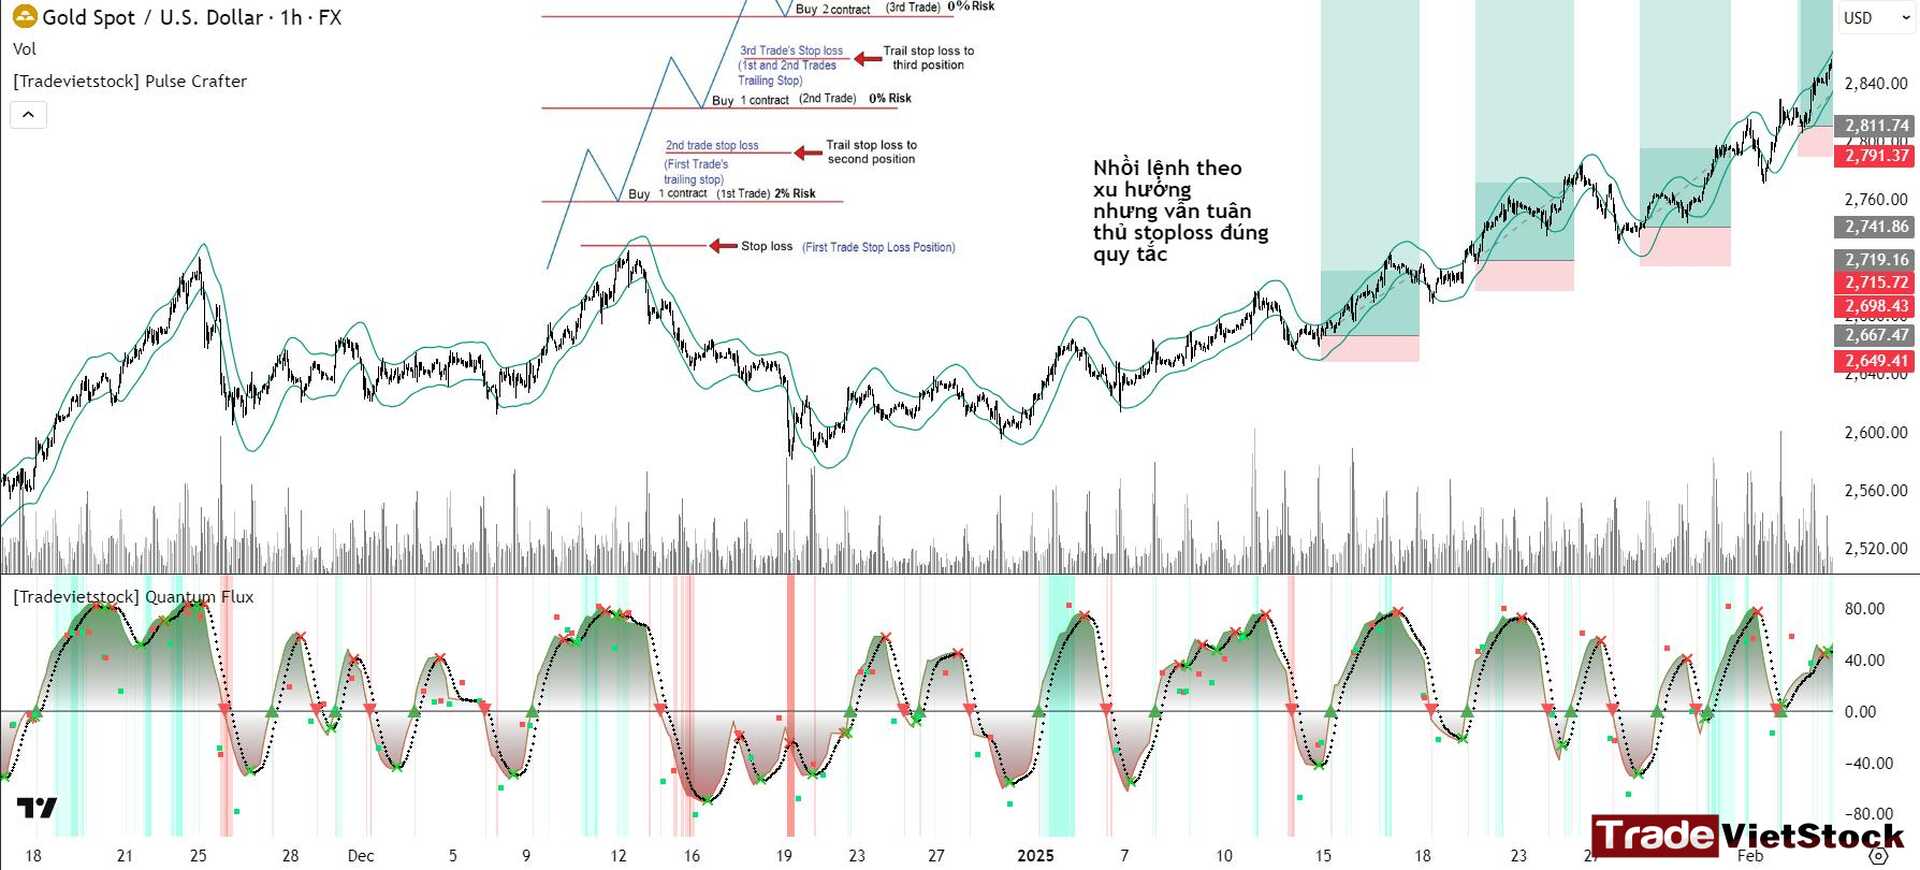
To apply Pyramiding, you add (Long orders) when the price rises during a bullish market phase. This approach helps build a larger position, thereby increasing potential profits.
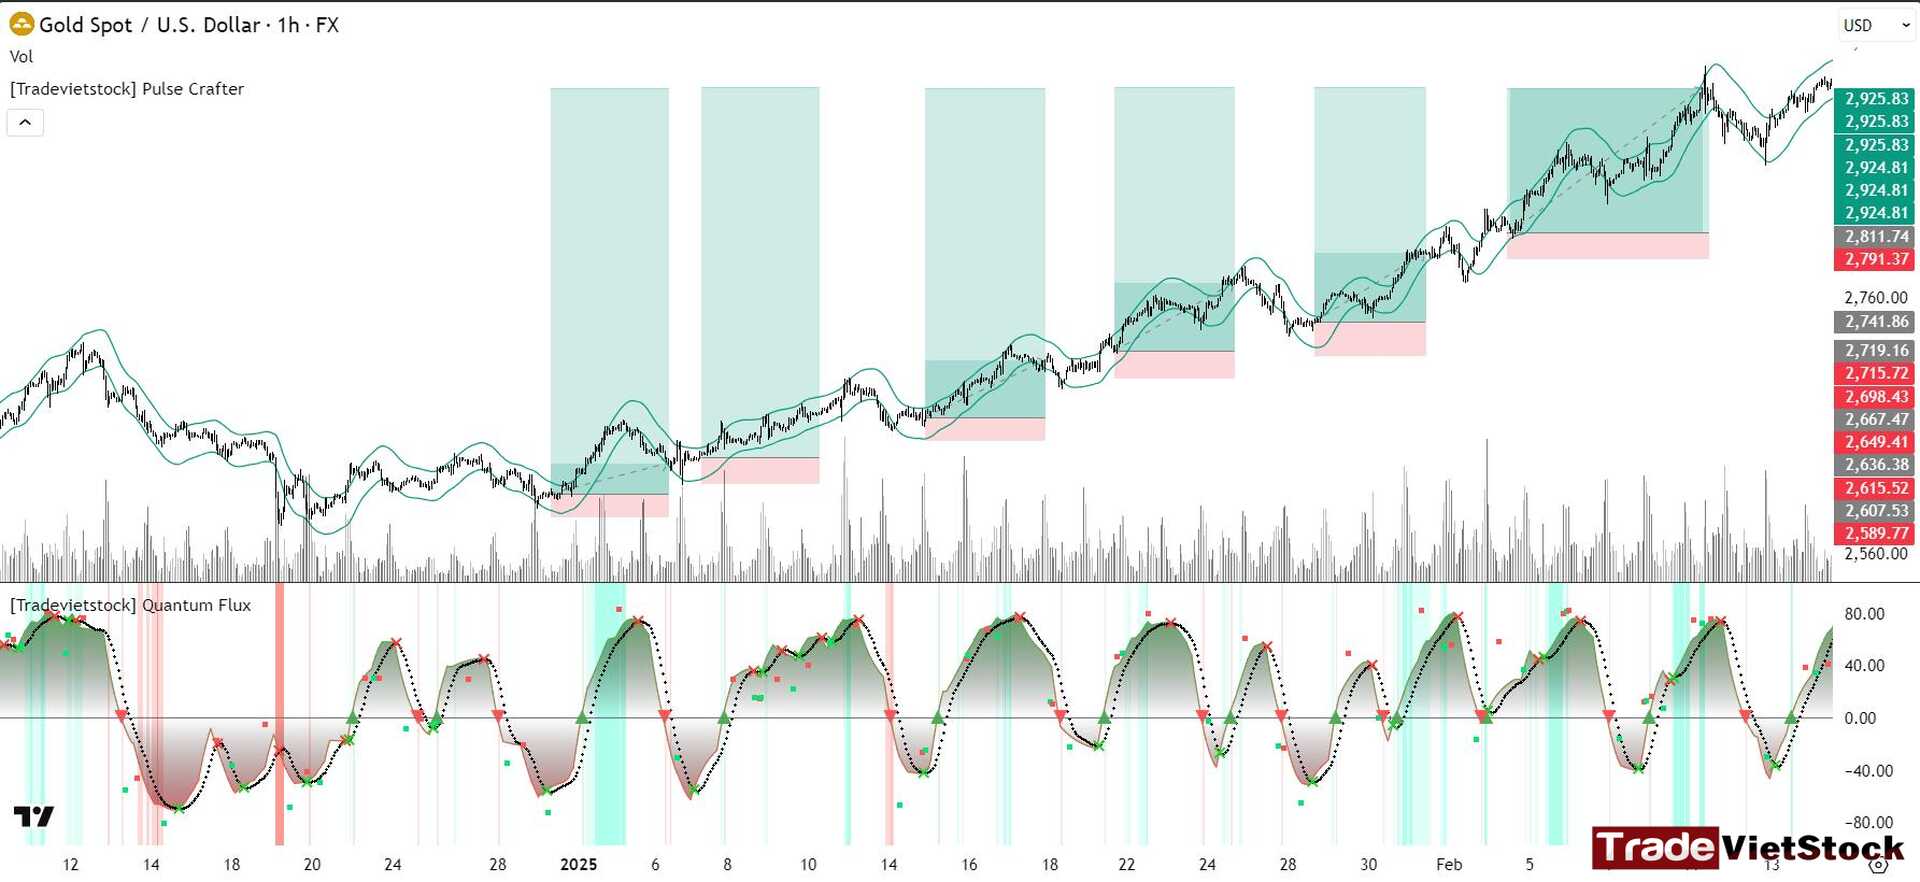
Example: Suppose you trade Gold (XAUUSD) on the Forex market with an account of 10,000 USD. You expect gold prices to rise and proceed as follows:
- Trade 1: Buy 0.1 lot of gold at 2,607.53 USD/oz, with a stop-loss at 2,589.77 USD/oz
- Trade 2: Price rises to 2,667.47, then slightly pulls back to 2,636.38. You decide to buy another 0.1 lot of gold with a stop-loss at 2,615.52
- Trade n: The price continues rising with retests. You take advantage of these retests to buy another 0.1 lot of gold (or reduce the size if needed)
This process repeats continuously until one of the positions hits stop-loss, your profit target is achieved, or you see strong reversal signs in gold.
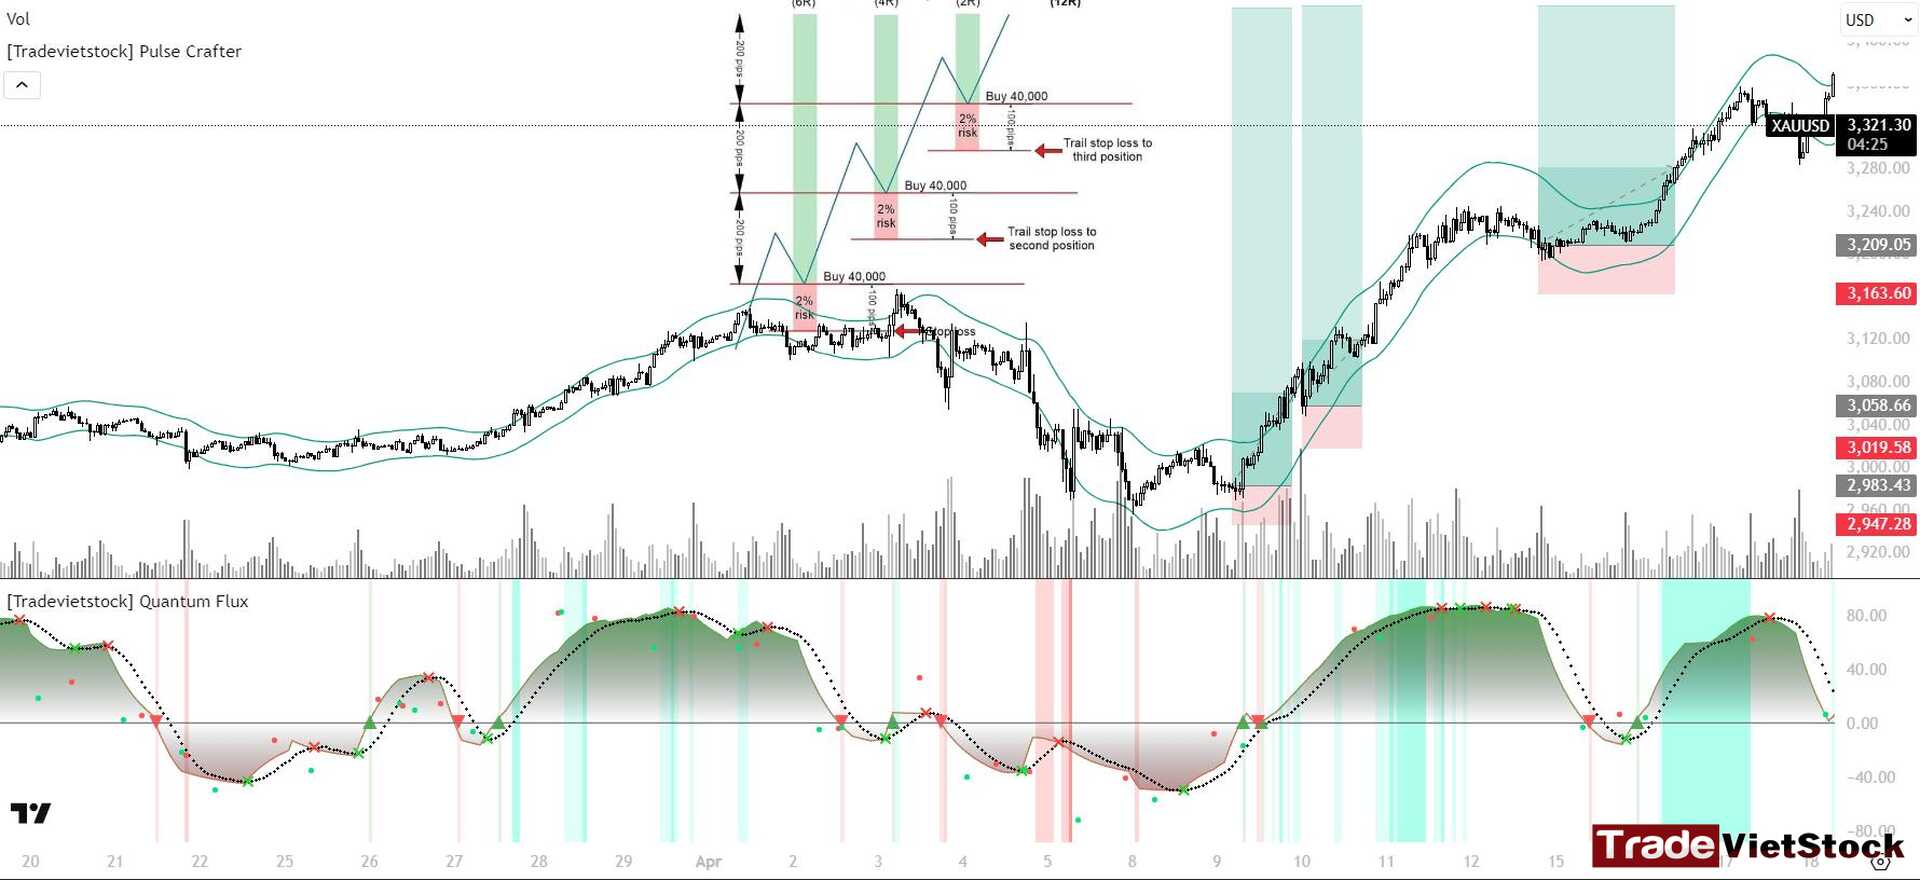
In total, you hold 0.6 lots of gold with an average buying price of:
(2607 + 2636 + 2667.47 + 2719 + 2741.9 + 2811.7) × 0.1 ÷ 0.6 = 2,697.18 USD/oz
When the price reaches 2,925.83 USD/oz, you sell all 0.6 lots of gold and the profit you make is 13,719.1 USD
With an initial capital of 10,000 USD, you’ve achieved a 137% growth on your total account.
If you hadn’t used Pyramiding, and only bought 0.1 lot of gold at 2,607 USD/oz and sold at 2,925.83 USD/oz, the profit would have been just 3,188.3 USD.
A huge difference, right?
3. Types of Pyramiding
Below are the common types of Pyramiding:
- Standard Pyramid: Start with the largest position, then add smaller positions afterward.
Example: Buy 100 shares initially, then add 80 shares, then 50 shares.
- Inverted Pyramid: All positions have the same size (for example: adding 100 shares each time).
This method carries higher risk because even a small reversal can wipe out profits.
- Reflecting Pyramid: Increase the position size up to a certain level, then gradually reduce it by taking profits — even when the trend continues.
This is a less aggressive method and usually brings lower profits.
- Maximum-Leverage Pyramid: Increase positions with the largest possible size allowed based on margin requirements and accumulated profits.
This is a high-risk, high-reward approach.
4. Advantages of Pyramiding
- Reduces premature capital pull-out:
Pyramiding helps traders avoid selling too early when there’s a slight price pullback.
It encourages evaluating whether a movement is a true reversal or just a temporary correction, creating opportunities to add more trades.
- Compound profit effect:
By focusing on assets with continuous trends, Pyramiding promotes compound growth, balancing between potential returns and risk.
- Flexibility:
Allows adjusting your position according to market fluctuations — increasing or reducing positions when necessary.
5. Disadvantages of Pyramiding
- Requires a sustained trend:
Pyramiding only works effectively when the asset price moves steadily in one direction over a period of time.
- Risk of large losses:
If the price reverses earlier than expected, this strategy can lead to significant losses.
That’s why you must STRICTLY follow STOP-LOSS rules.
iii. Kelly Criterion
1. Basic Concept
Kelly Criterion is a mathematical model that helps determine the optimal percentage of capital to risk on each trade in order to maximize long-term returns while minimizing the risk of capital loss. This formula was developed by John L. Kelly Jr. and is particularly popular in both trading and betting.
It’s a highly effective model for capital management in trading that I personally often use.
In addition, this model allows you to simulate possible scenarios over many years, helping you adjust and refine your capital management system in investing and trading.
Kelly Formula:
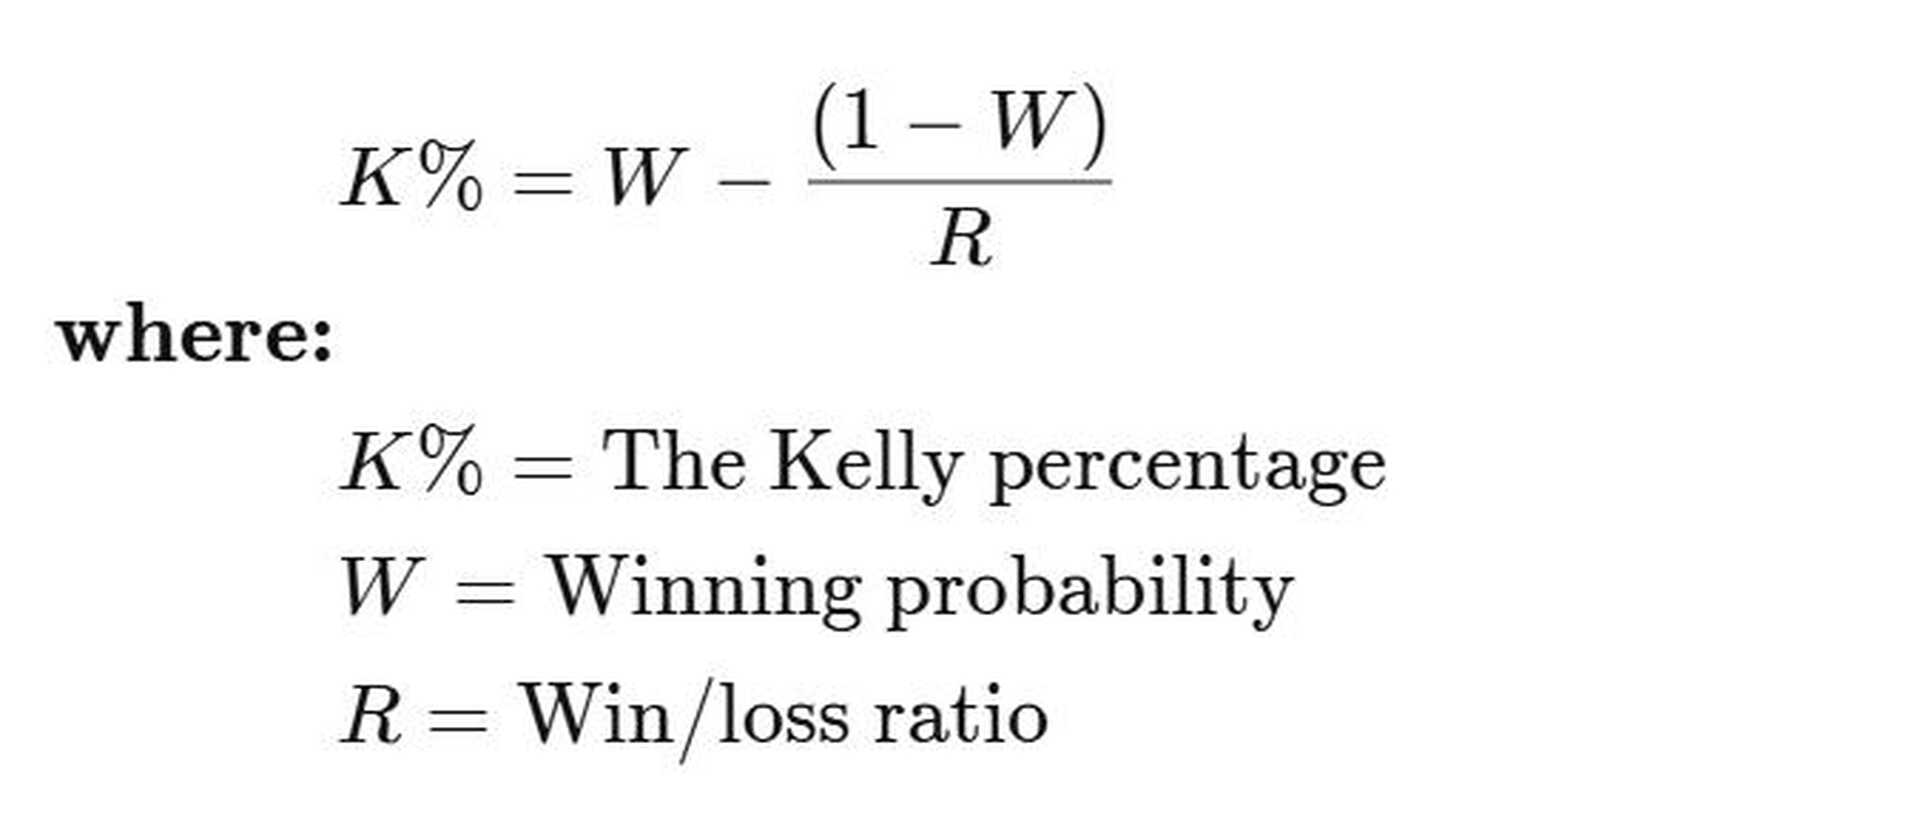
f = (bp – q) / b
Where:
- f: The percentage of capital to risk
- b: Reward-to-risk ratio
- p: Probability of winning the trade
- q: Probability of losing (q = 1 – p)
Additionally, there’s a supplementary formula to further optimize investment effectiveness:

Advantages:
- Optimizes long-term returns if you have accurate data on win rate and reward-to-risk ratio (R:R)
- Helps determine position size based on statistical data
Disadvantages:
- The model is relatively complex because it requires accurate probability data for winning/losing trades.
Therefore, you need to continuously backtest your strategy to build a sufficiently large data set.
- Difficult to build because it requires knowledge of mathematics and proficiency in Excel for creating simulations.
2. Example Illustration
Suppose you have a Forex trading strategy with the following parameters:
- Total account balance: $100,000
- Risk per trade: 0.2%
- Winning probability (p): 60% (0.6)
- Losing probability (q): 40% (0.4)
- Reward-to-risk ratio (R:R): 4:1 (each trade risks $200, with an expected profit of $800 per win)
- Total number of trades: 290
The Issue
Even with the same 60% win rate, the actual results of each trading sequence will vary greatly due to the order in which wins and losses occur.
For example: With a 60% win rate, the win–loss sequence could be distributed in several ways:
- Sequence A: 5 consecutive winning trades at the start, followed by a series of losses
- Sequence B: alternating wins and losses
- Sequence C: a losing streak at the beginning of the session before recovering with wins later
Even though the average win rate remains 60%, the different orders of wins and losses will lead to different outcomes in terms of drawdown, cumulative profit, and trader psychology.
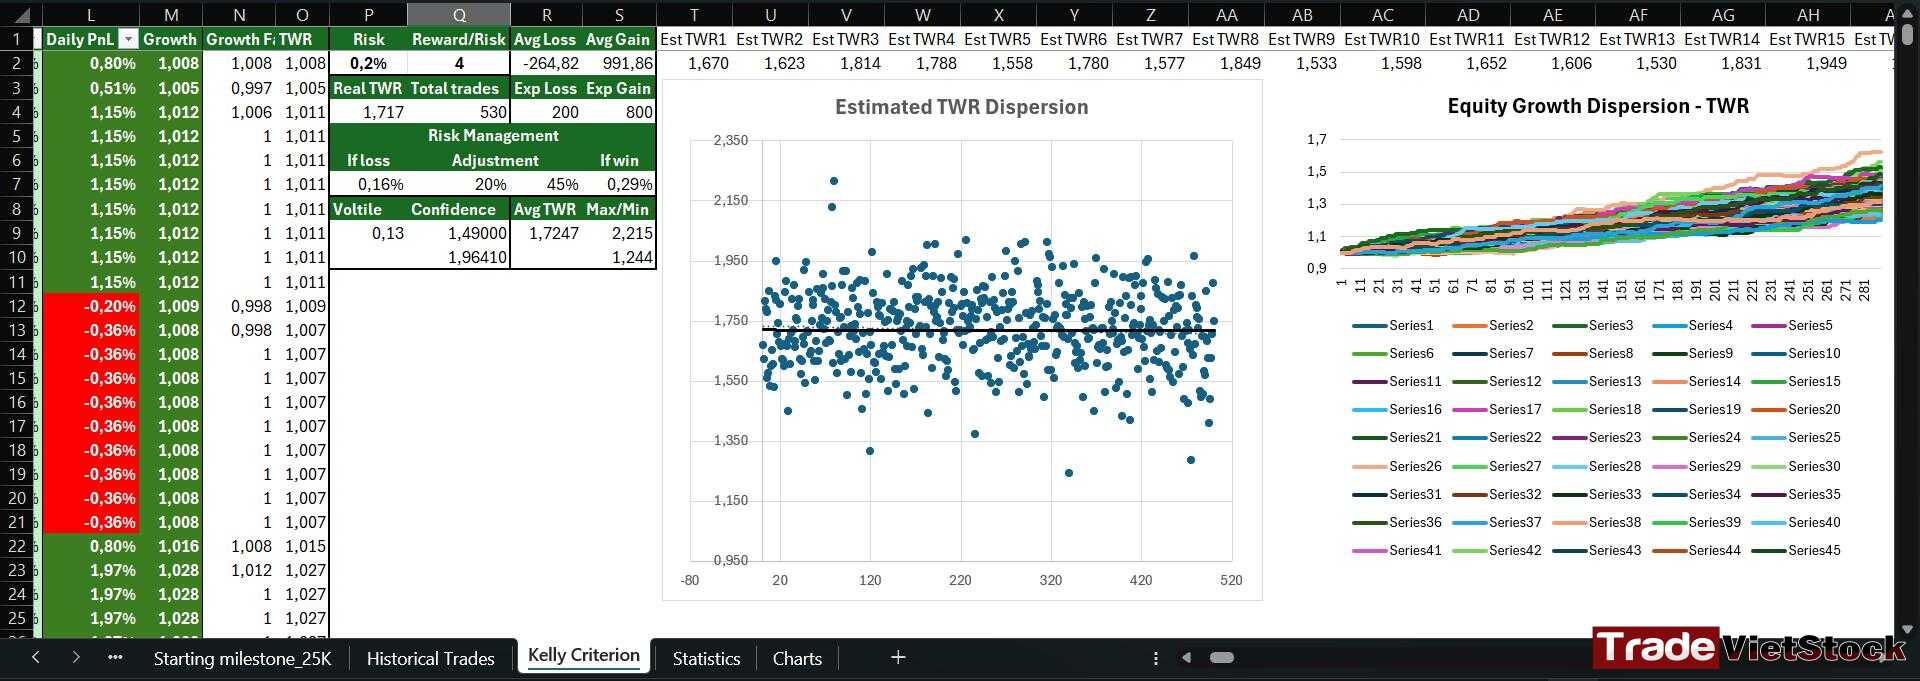
Solution: Use Monte Carlo Simulation
To test the stability and actual risk of this strategy, we need to use the Monte Carlo simulation algorithm to generate multiple random scenarios based on the same input parameters.
Specifically, we will use an algorithm (or Python code, Excel VBA, or specialized simulation software) to create 500 random scenarios of trading result sequences, with a 60% win probability and 40% loss probability.
Each scenario will show the specific sequence of trades, the profit/loss of each trade, and the final account balance after the entire series.
Example Illustration of Order and Combination Impact
To better visualize the impact of order, let’s consider a simple example:
Suppose we have 3 elements: X, Y, Z
The number of different ways to arrange them is:
3! = 6 ways, including:
- X – Y – Z
- X – Z – Y
- Y – X – Z
- Y – Z – X
- Z – X – Y
- Z – Y – X
Even though the number of elements remains the same, simply changing the order results in different overall outcomes.
Applying to a Trade Sequence
Similarly, with each trade having only two possible outcomes:
- Win (W)
- Loss (L)
For 10 trades, the number of possible scenarios is:
2¹⁰ = 1,024 cases
Example with 3 trades:
- W – W – W
- W – W – L
- W – L – W
- W – L – L
- L – W – W
- L – W – L
- L – L – W
- L – L – L
A total of 2³ = 8 possible scenarios
If extended to 290 trades, the number of possible outcomes is 2²⁹⁰ — a number far too large to calculate or list manually.
Why 500 Monte Carlo Simulations Are Necessary
Therefore, running 500 Monte Carlo simulations is necessary to:
- Generate 500 random trade sequences that match the real-world probability (60% win, 40% loss)
- Calculate profit, drawdown, and final account balance for each sequence
- Evaluate the expected profitability, potential risk levels, and account blow-up probability
Although 500 cases still aren’t a huge number, they are enough to give you a clear visual reflection of your strategy’s long-term performance.
And typically, your real trading results will fall within your confidence range — the range where most cases are likely to occur.
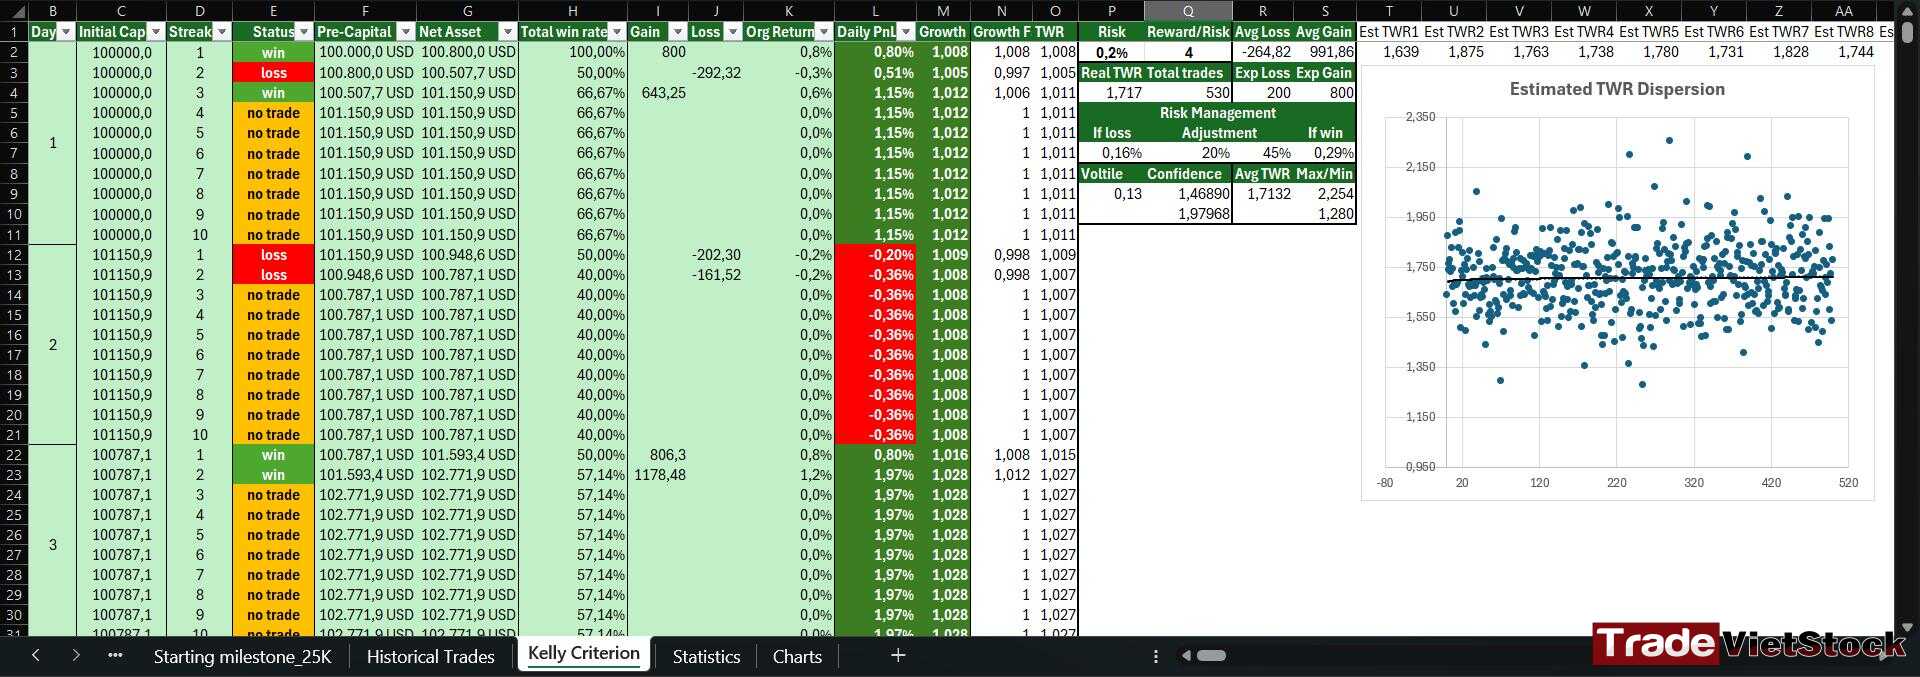
This is the most practical and intuitive method to verify the stability and long-term effectiveness of a probability-based trading system, instead of relying solely on average win rate figures.
The results for the scenario above would be as follows:
- Average growth: approximately 72% after 290 trades, including “No trade” situations (cases where no trades were executed).
If counting only the Executed Trades, the total number of trades was 118 trades over 53 days.
- Highest growth: 125.3%
- Lowest growth: 27%
- Confidence interval:
Meaning, the majority of scenarios fall within a growth range of approximately 43% to 98%
In addition, you need to fine-tune your risk management system — for example, when you take a loss, you must adjust the Risk per trade for the next order accordingly, and do the same after a winning trade.
iv. Comparison of Capital Management Methods
| Method | How It Works | Advantages | Disadvantages |
| Fixed Fractional (Fixed %) | Risk a fixed percentage of the account per trade (e.g. 1% of account per trade) | Simple, easy to manage, psychologically safe | Does not maximize account growth speed |
| Pyramiding (Stacked Entries) | Add to your position as your trade moves into profit, increasing position size when the market favors you | Optimizes profits when catching a strong trend | Can easily get excessive; requires tight control |
| Kelly / Optimal F | Bet the mathematically optimal percentage to maximize average long-term account growth | Theoretically the most optimal in the long run | High risk, sensitive to losing streaks, difficult to estimate accurately |
v. Conclusion and Open a Trading Account
Capital management in trading and investing is a survival skill for both traders and investors, whether you’re in the stock market, Forex, or Crypto.
No matter how effective your trading strategy is, if you don’t have a solid money management system, the risk of “blowing your account” will always be lurking.
The three methods we’ve covered — Fixed Fractional Position Sizing, Pyramiding, and Kelly Criterion — offer different approaches, each suited to different levels of experience, profit objectives, and risk tolerance.
- Fixed Fractional Position Sizing is an ideal choice for beginners or those who prioritize safety and simplicity.
This method helps you tightly control risk, leverage compounding for long-term growth, though it may limit profits if your capital is small or your risk percentage too low.
- Pyramiding suits experienced traders, especially in strongly trending markets.
It maximizes profits when you correctly predict a trend, but it demands strict stop-loss management skills to avoid large losses if the market reverses.
- Kelly Criterion is a powerful tool for those who want to optimize profits based on statistical data, but it requires you to accurately analyze your win/loss probabilities and be willing to accept higher risk.
To choose the right method, ask yourself:
- What is my objective?
Do I want steady, safer growth, or am I ready to accept higher risk to maximize profits?
- What is my risk tolerance?
Can I stick to the plan with discipline?
- Most importantly — am I willing to invest the time to build and test my own capital management in trading system?
The next step is to practice.
Start by building a file for your own capital management in trading (like the Fixed Fractional Excel example) and test it out on a demo account.
Whatever method you choose, always use stop-losses, monitor your trading performance, and adjust your strategy as needed.
Capital management in trading and investing is not just a technical tool — it’s how you protect your mindset and sustain yourself on the journey to becoming a professional trader.
📌 Interested in learning more about different account types or crypto trading knowledge? Check out our educational resources HERE
📌 Want to see detailed reviews of the top 5 best crypto exchanges? Read the full review HERE
Furthermore, if you want real-time signals everyday, you can check out our small Investment and Trading community on Telegram: [HERE]
Don’t forget to follow this Investment and Trading Signal for free investment analysis and trading crypto and forex CFDs signals.
I know trading isn’t an easy game, especially for those who take it seriously. That’s why I believe you should practice consistently before finding the trading strategies that suit you best. You can start risk-free by opening a demo FX account to get familiar with the market.
Below are registration links for two of the best brokers:
- XTB Online Trading — the top broker for traders in the EU
- Exness — the best choice for traders in Asia
You can also experience world-class services and trusted reputations from some of the top 5 crypto exchanges:
- Binance — The largest crypto exchange on Earth
- Bybit — A well-established name known for its long-standing reputation and diverse financial instruments
- Bitget — User-friendly interface combined with a strong reputation
- MEXC — The lowest trading fees with one of the most beginner-friendly interfaces
- OKX — A major name known for secure asset storage and powerful DEX tools


 Tiếng Việt


