2025 Stock Market Crash – The Biggest Bluff
| Date: 08/04/2025 | 890 Views | Investment and Trading Signal |
Where to Invest in 2025 Stock Market Crash – The Biggest Bluff, Reaching Bottoms or Downtrend
Hello folks, it’s Tradevietstock again! Today, global stock markets are facing a string of “red-hot” sessions after the U.S. announced tariffs on various countries. Let’s explore the mid-term investment opportunities and assess the risks and rewards in this complex environment.
In this article, “Where to invest in 2025 stock market crash,” I will gather data on Asian stock indices and the Dow Jones. Is a harsh winter on the horizon, or could this be a historic opportunity?
i. Analysis of Global Stock Market Indices
Instead of relying on traditional technical analysis to identify historical market bottoms and confirm future trends, we utilize our proprietary algorithmic indicators combined with statistical probability analysis. These tools are highly accurate and data-efficient across major indices such as the Dow Jones, Nikkei, Nifty, and Hang Seng Index.
1. United States – Dow Jones (DJI)
Currently, the Dow Jones is down nearly 20% from its peak, with a steep decline that stands out as rare in its history. Such sharp drops are uncommon for the index.
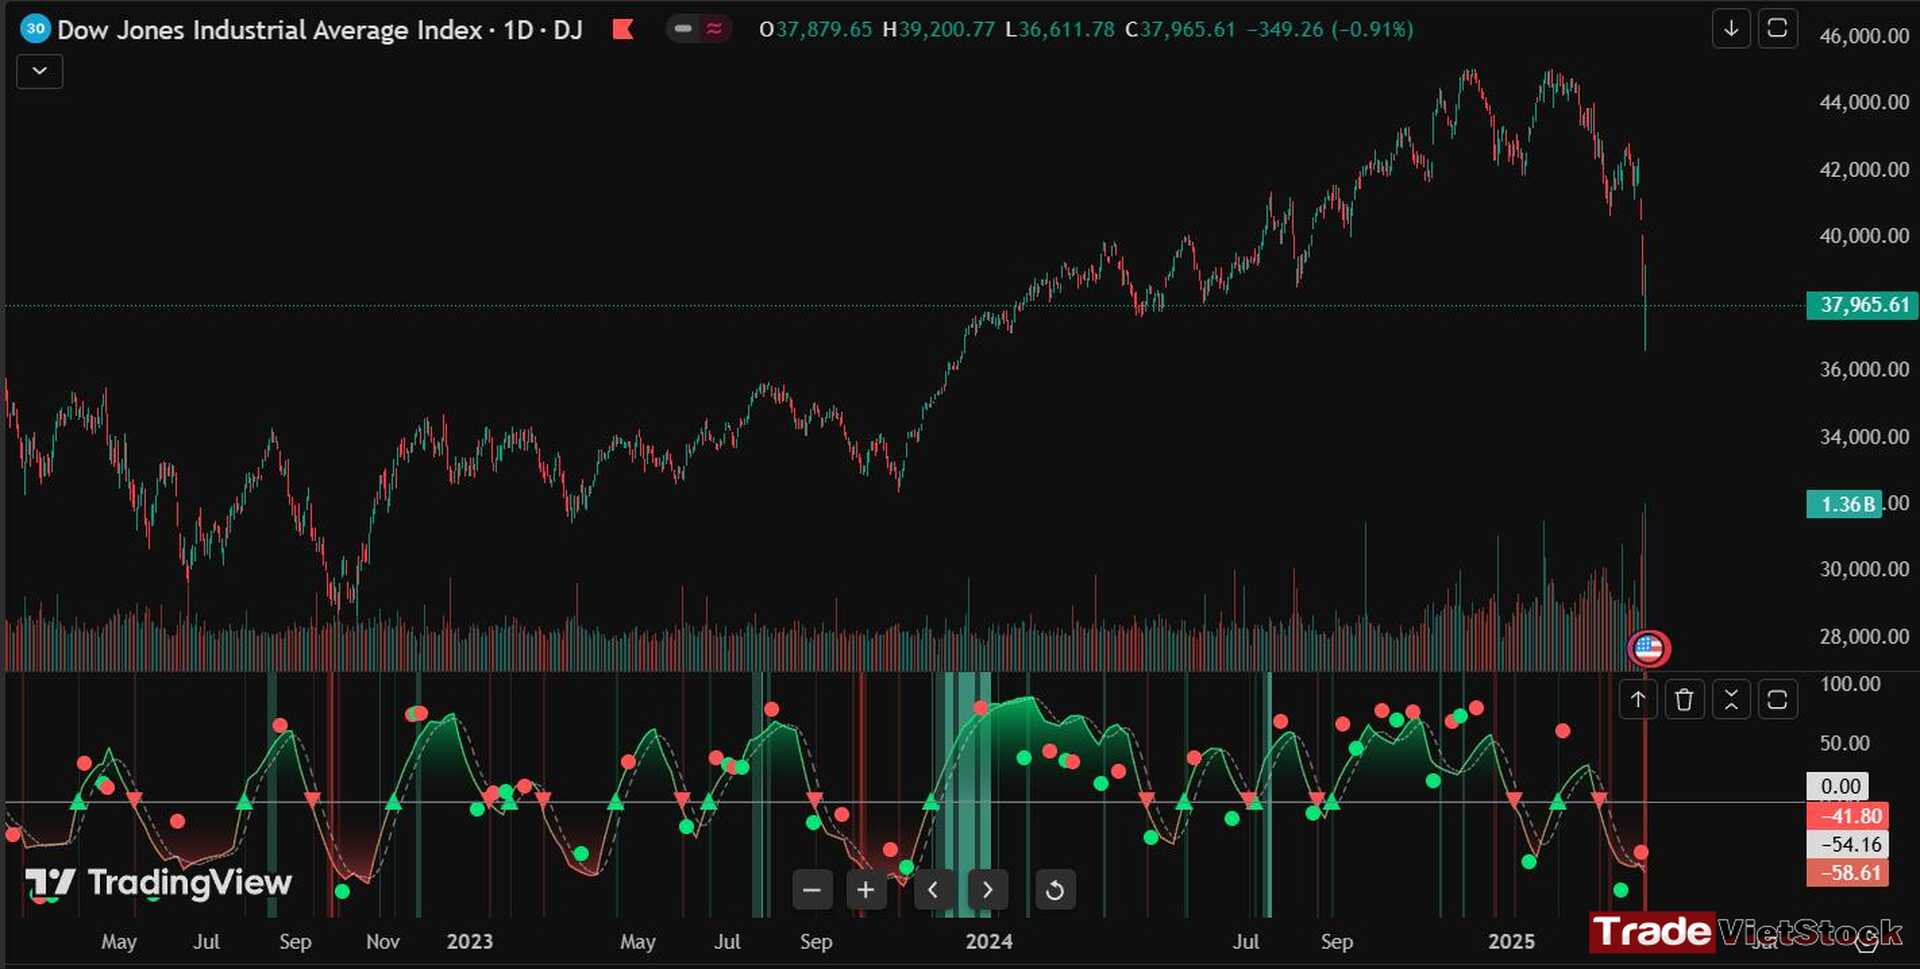
When filtering quantitative data, we can observe the following scenarios. The key takeaway from this analysis is that the Dow Jones is likely to form a major bottom, setting the stage for a strong upward cycle.

Based on probabilistic modeling, the Dow Jones is expected to hit its bottom from the 50th trading session onward, counting from April 4, 2025. The projected bottom range is approximately 32,184 to 33,717. The recent recovery doesn’t yet represent the major bottom, meaning we’ll need to wait longer for that turning point.

=> Conclusion: The Dow Jones has not yet formed its major bottom and likely needs to decline another 8% or so. However, the recent recovery marks the first sign that it’s gradually approaching a significant bottoming zone.
2. Japan – Nikkei 225 (NI225)
The Japanese market shows signs of forming a major bottom in the short term. Recently, the Nikkei 225 dropped over 7% in a single session—one of the largest single-day declines in its history. Historically, such sessions often signal a significant bottom.
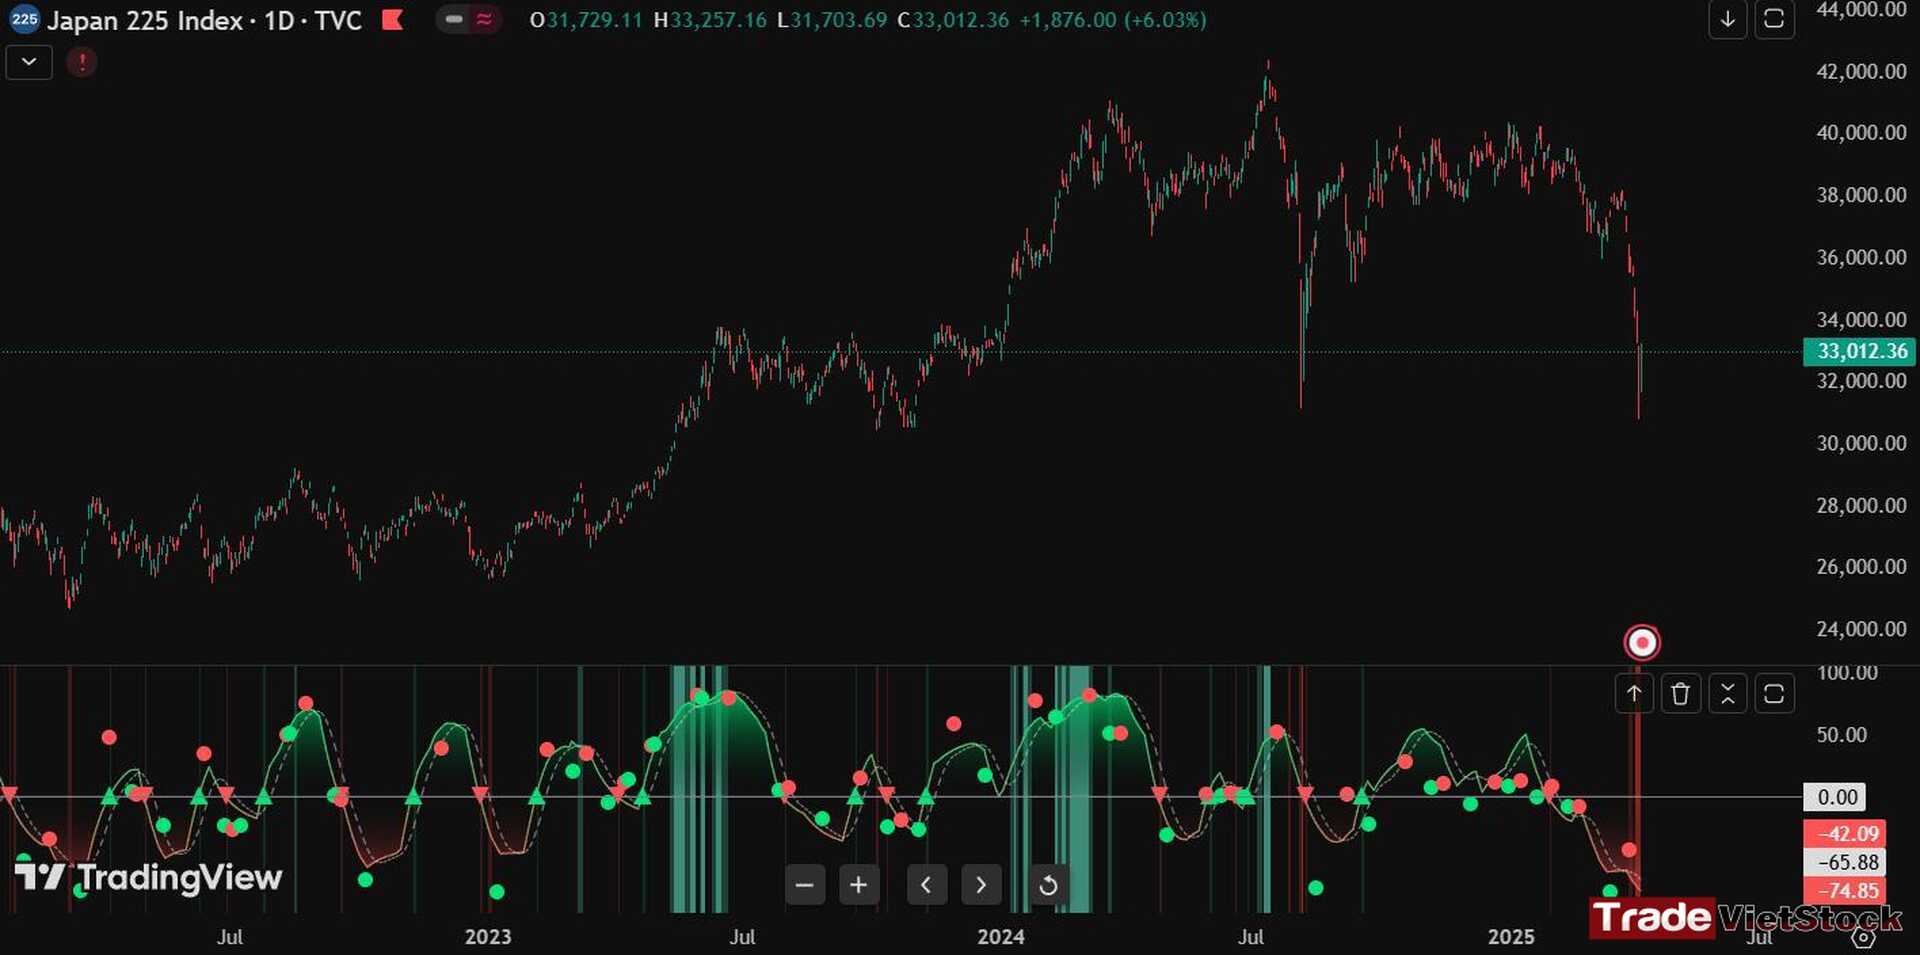
Below is a summary of instances when the NI225 fell over 7% in a session. These events clearly indicate major bottoms.

Probability results suggest a highly positive signal for the NI225, confirming that the drop on April 4, 2025, was indeed a major bottom.
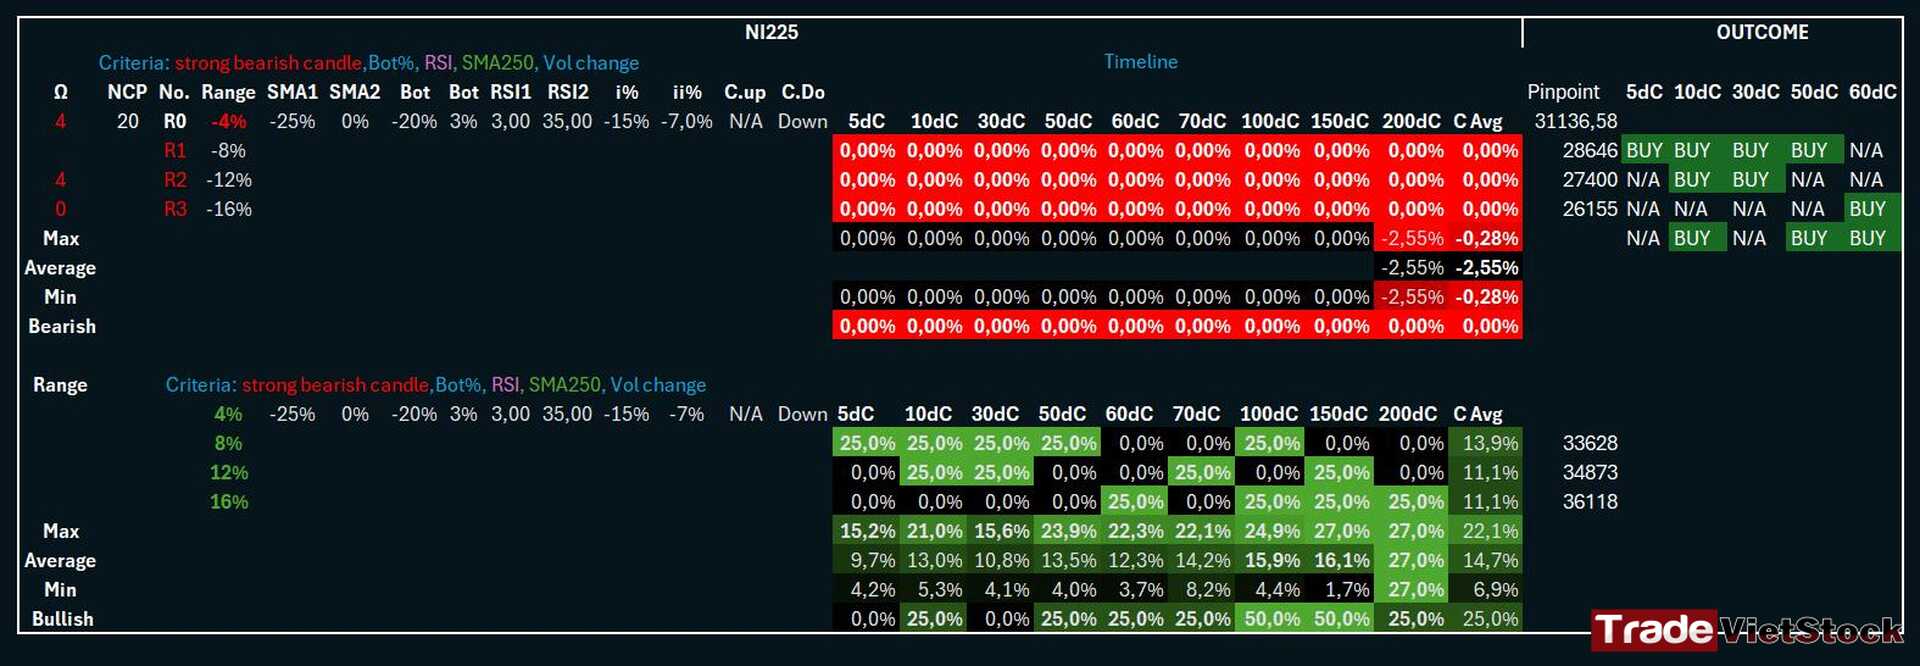
=> Conclusion: The NI225 shows the clearest signs of bottoming among all international indices right now. Since its inception, the Nikkei 225 has rarely seen declines exceeding 7%, and when they occur, they’ve consistently been followed by immediate recoveries.
3. Hong Kong – Hang Seng Index (HSI)
The HSI recently experienced one of the steepest single-session drops in its history—and the sharpest in Asia currently—losing over 13%.

Statistical analysis of HSI sessions with declines over 5% (using consistent quantification) reveals that these are key turning points.
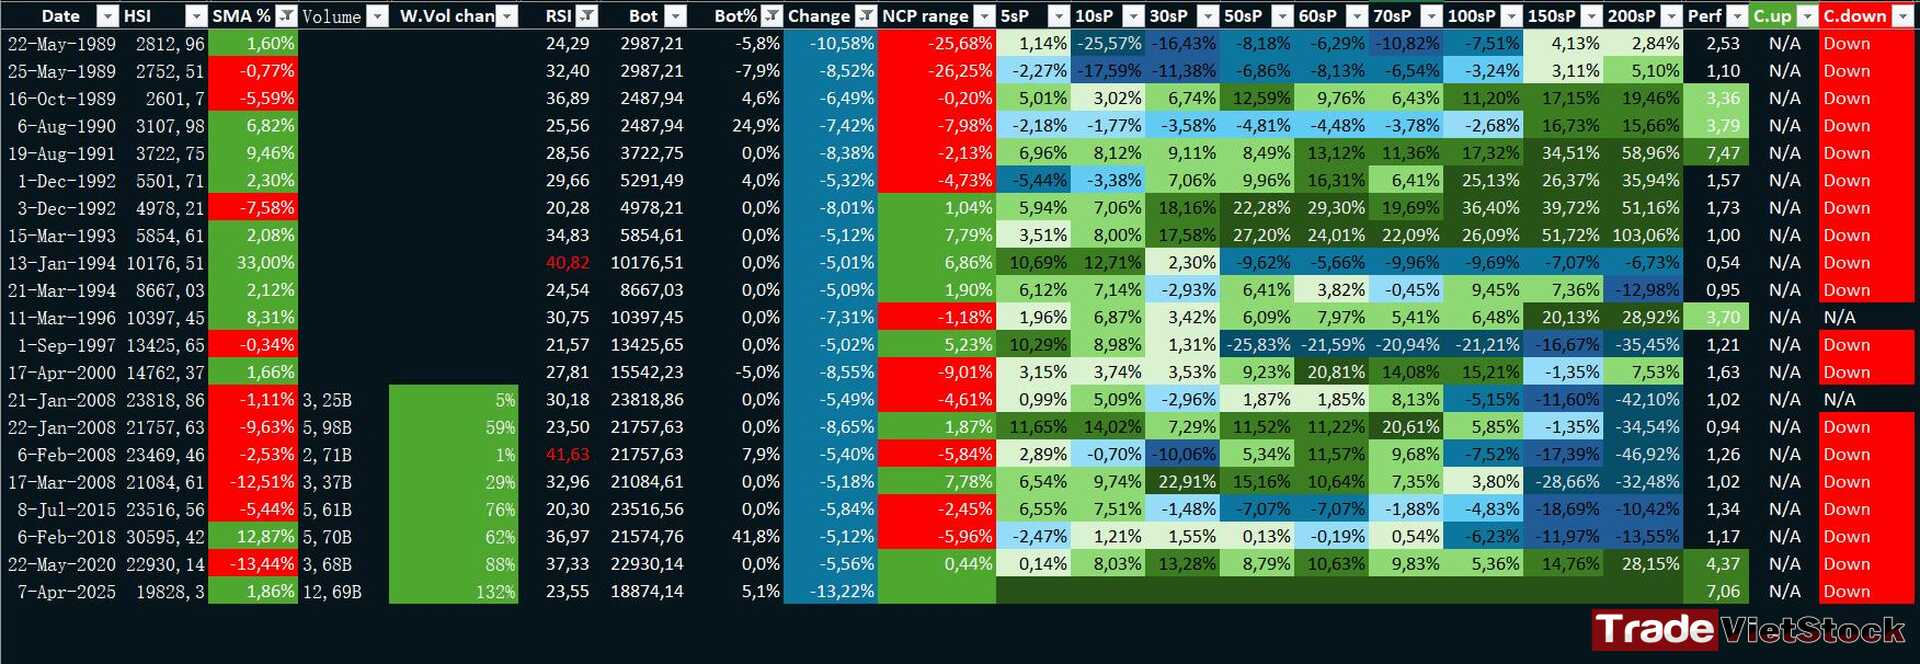
Probability results indicate that confirming the HSI’s bottom will require waiting between the 10th and 30th sessions from now. However, we can be confident that the major bottom is likely around the 18,242 level.

=> Conclusion: The HSI is showing signs of bottoming around 18,242, with the recent drop being one of its most significant in history. Probability suggests the bottom will be confirmed between the 10th and 30th sessions moving forward.
4. India – Nifty
For the Indian stock market, it’s highly likely that a decline confirming a bottom has yet to occur.
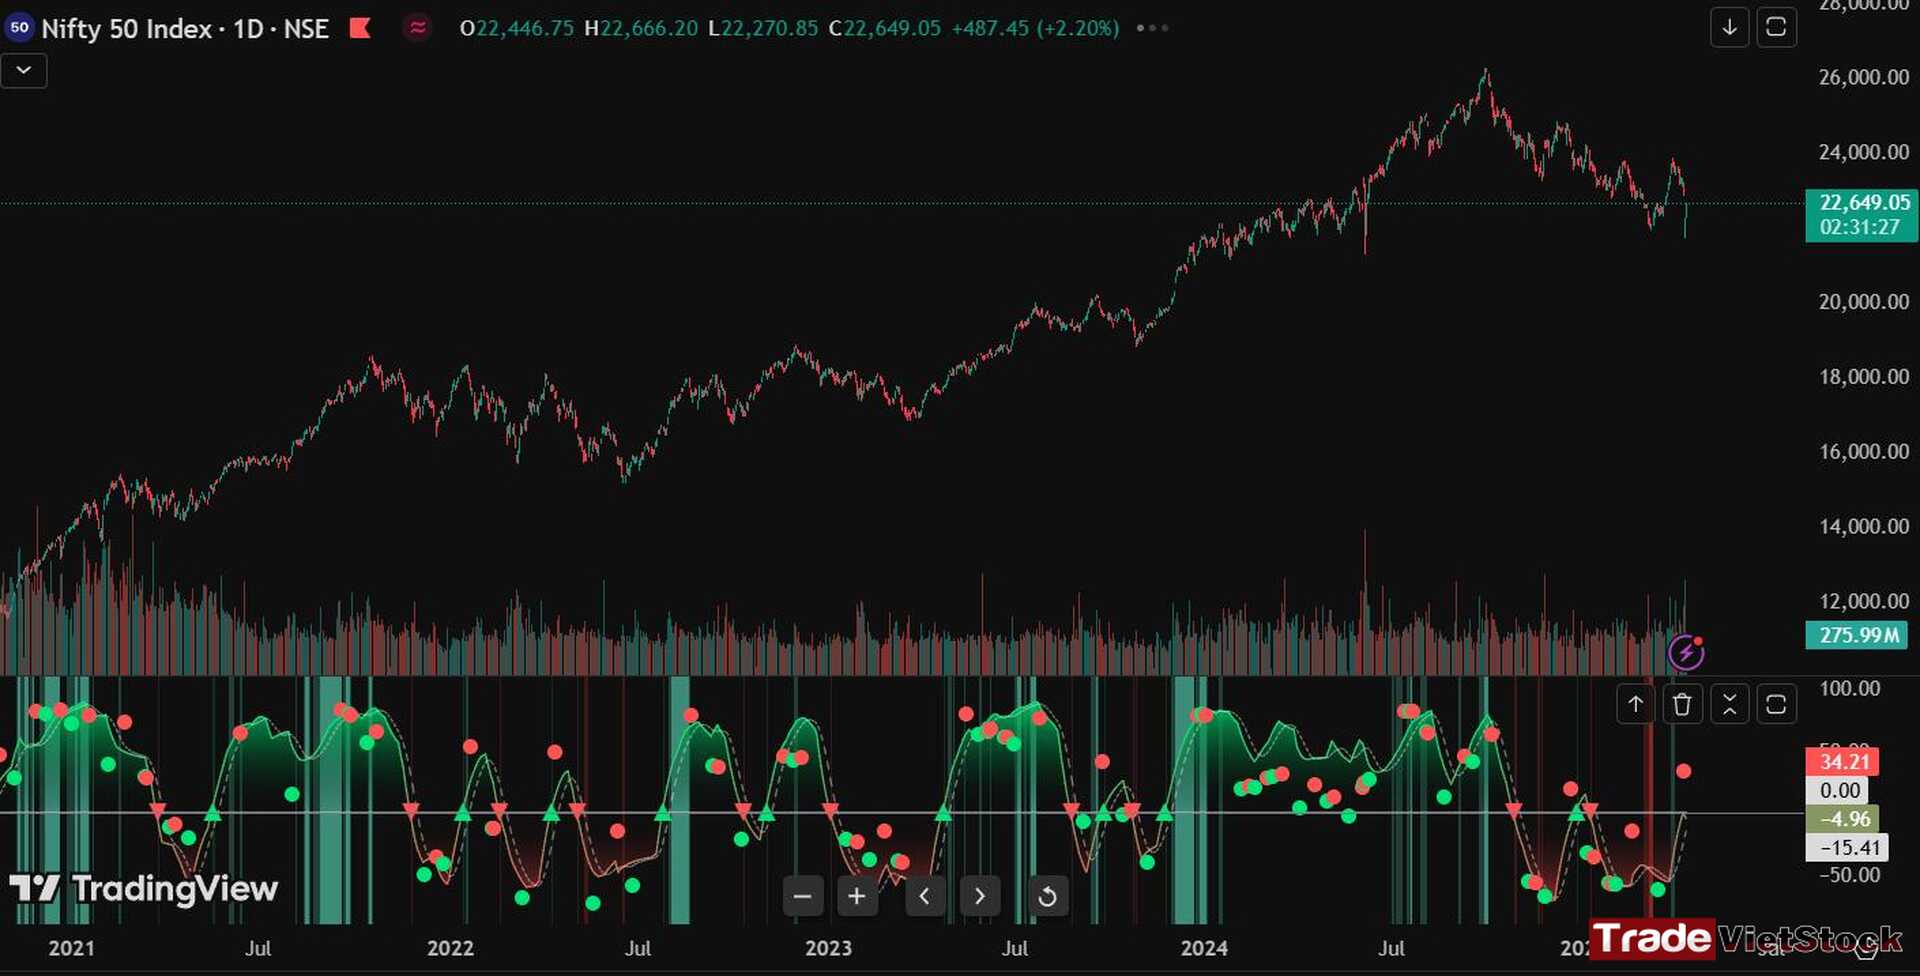
The statistical table of Nifty sessions with drops exceeding 3% (using consistent benchmarks) doesn’t reveal much of a clear story.

The probability results for Nifty are vague, indicating that we’ll need another significant drop to mark a key milestone.

=> Conclusion: The Nifty shows no clear signs of forming a major bottom yet. We’ll need to wait for another notable decline to signal that turning point.
After analyzing data from major markets like the U.S., Japan, Hong Kong, and India, it’s evident that most are forming historic bottoms with limited room left for further declines. The exception is the Nifty, which still awaits a stronger signal and remains relatively negative in outlook.
ii. Sentiment Data
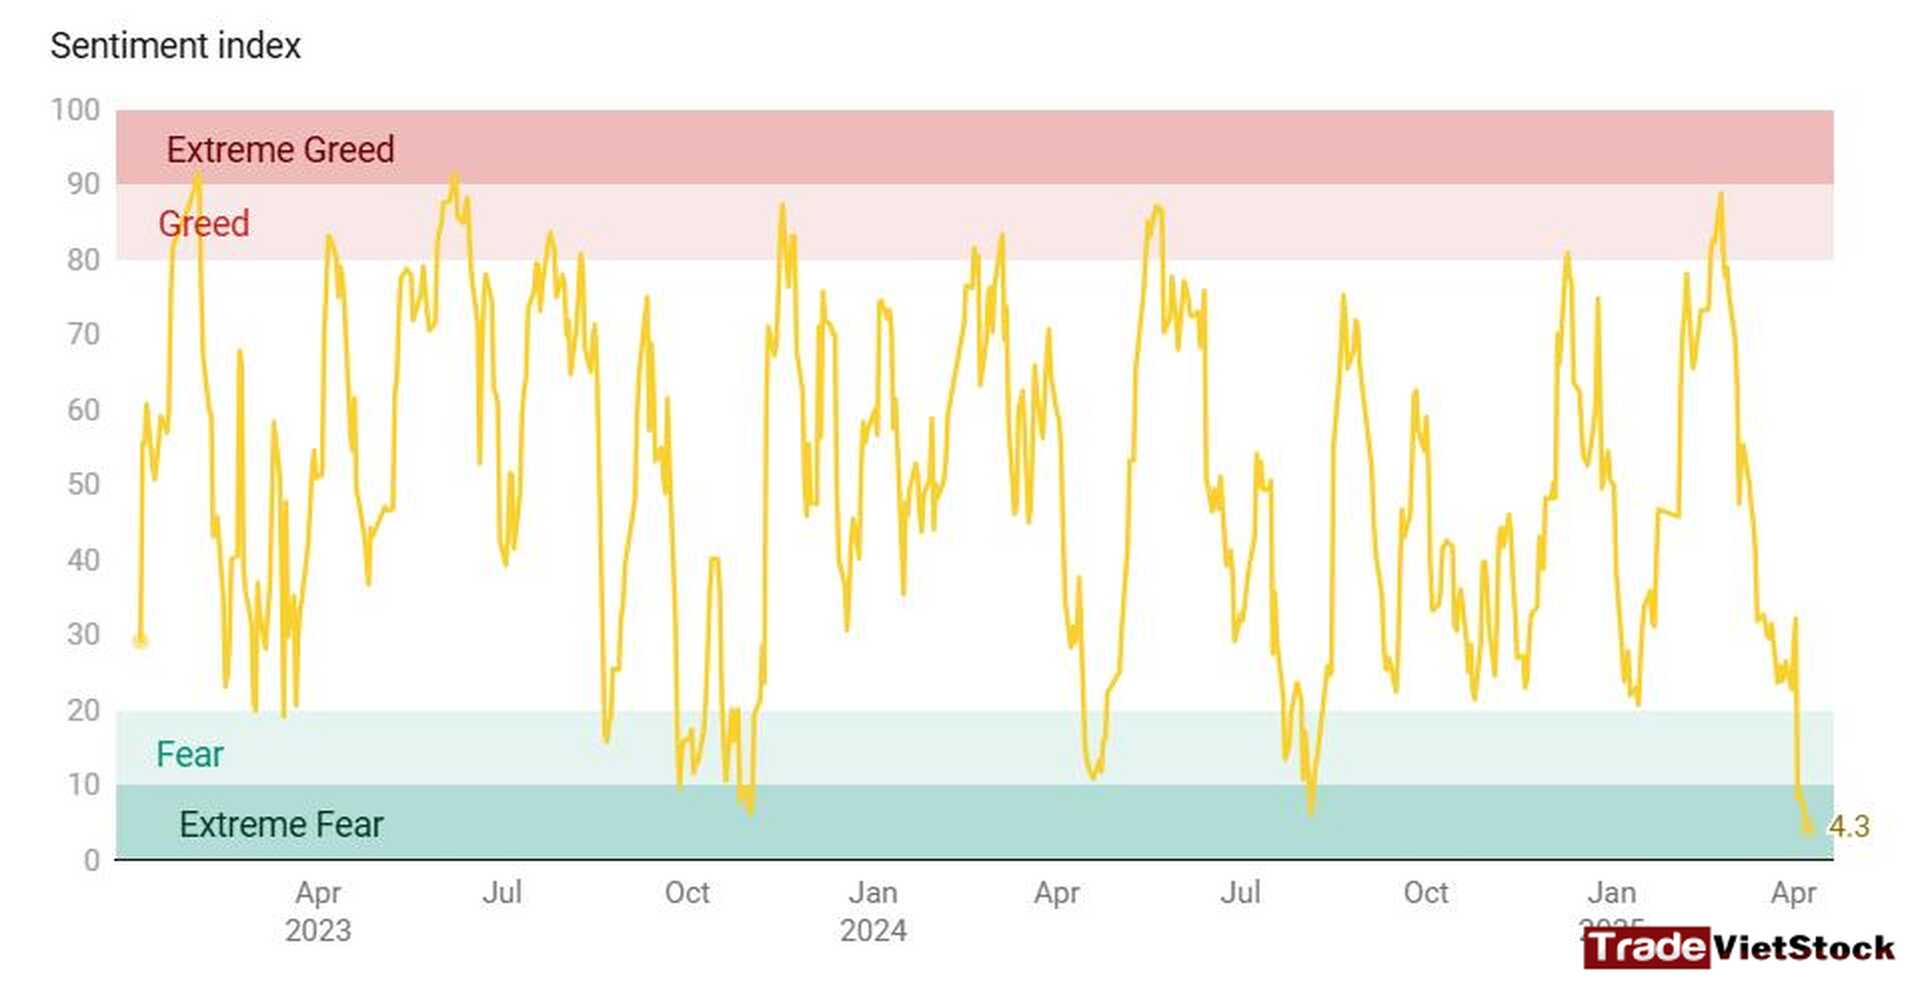
Currently, the market is in a zone of extreme fear, consistent with our previous analysis that a major bottom is forming in this region. The sentiment index is hovering around ~4 points, a low level comparable to August 5, 2024.
This panic isn’t limited to one region—global markets are in extreme turmoil, as shown by the CNN Fear and Greed Index. This indicator has dropped to the extreme fear zone, and historically, every time it hits this level, the S&P 500 forms a significant bottom.
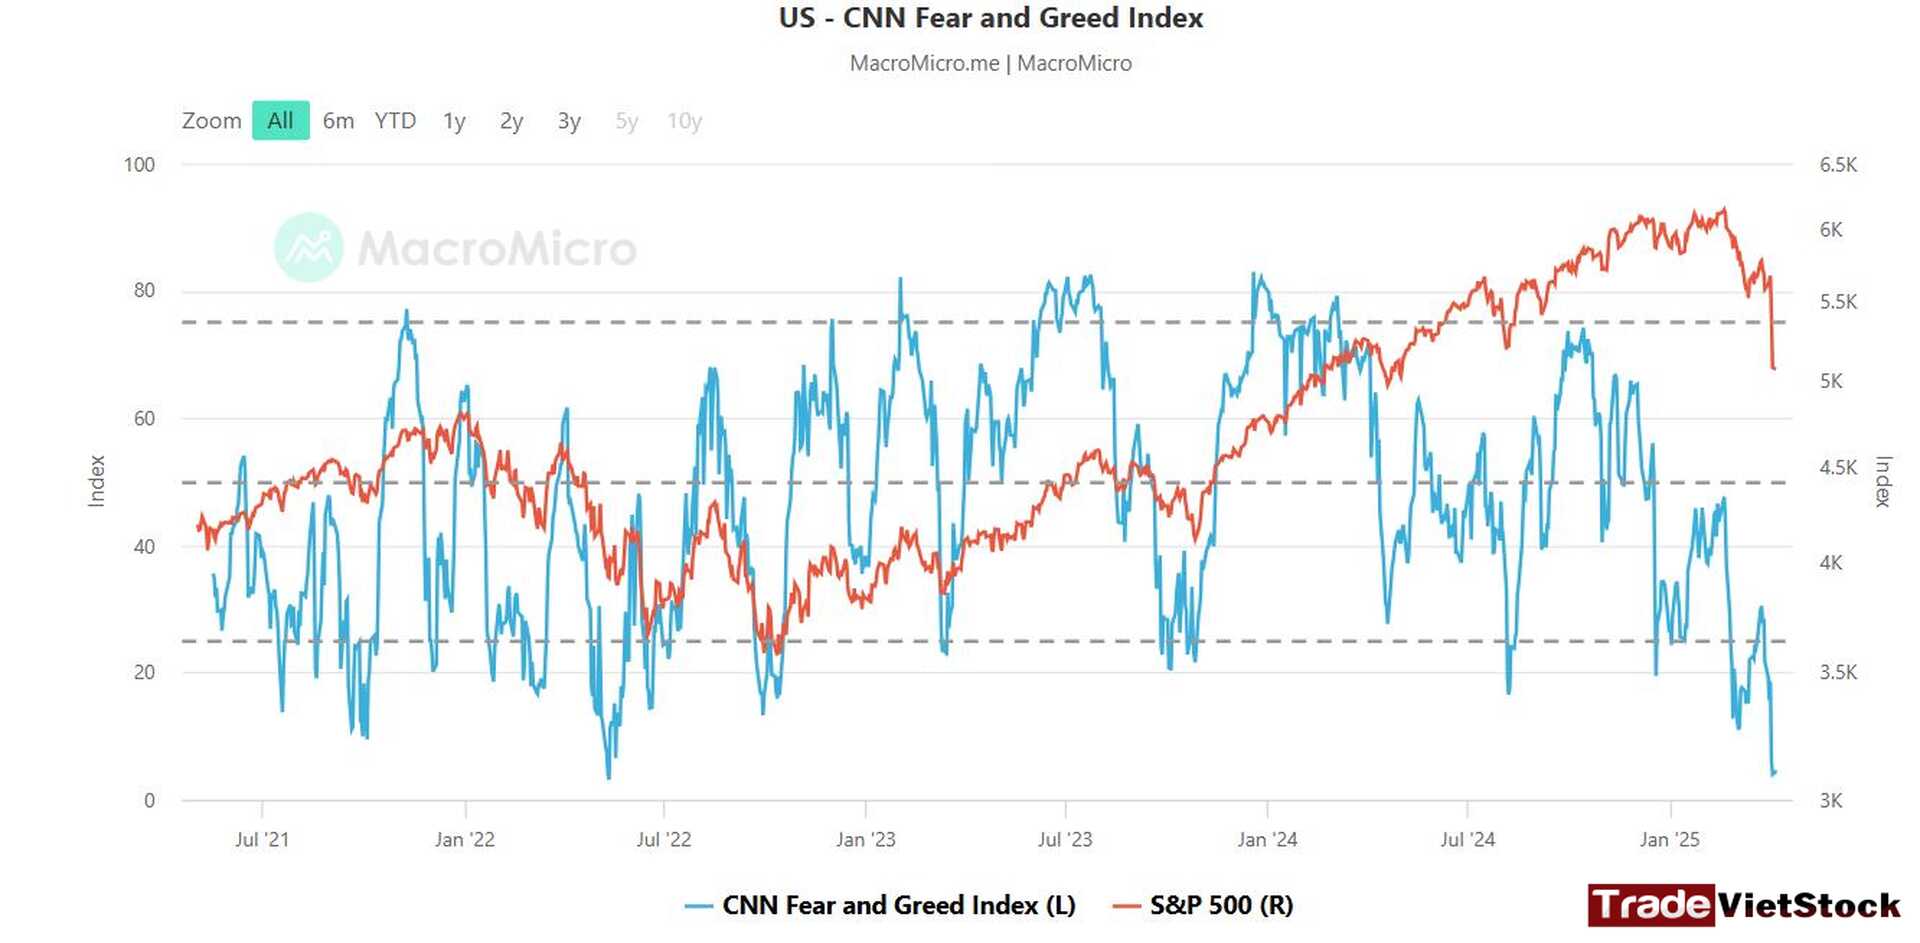
=> Global markets are gripped by fear and chaos. This is a positive signal for picking up undervalued stocks. Whenever the Sentiment Index reaches this zone, markets tend to form major bottoms and rise in the mid-to-long term.
iii. Investment Outlook for the Second Half of 2025
I take for this period is clear: don’t panic-sell. Instead, wait for the 10th to 30th sessions from April 2, 2025, to start accumulating. This extreme fear zone marks a historic bottom, setting the stage for a new uptrend with significant upside potential.
Is winter coming? I don’t think so. This is a historic bottoming zone preparing us for a strong uptrend ahead.
| Stock Index | Current Status | Key Data Point | Outlook |
| Dow Jones (DJI) | Down nearly 20% from its peak, expected to decline another 8% from current levels (projected bottom: 32,184-33,717). | Recent recovery marks the start of a major bottom zone. | Waiting for further decline of ~8%, bottom expected after the 50th session (April 4, 2025). |
| Nikkei 225 (NI225) | Recent drop over 7%, considered a major bottom signal. | The 7% drop historically signals a major bottom. | Clear bottom forming, recovery expected soon. |
| Hang Seng Index (HSI) | Recently dropped over 13%, expected bottom around 18,242. Confirmation needed between the 10th and 30th sessions. | The 13% drop is one of the biggest in HSI history, bottom expected around 18,242. | Bottom forming, confirmation expected between the 10th and 30th session. |
| Nifty | No clear bottoming signal yet, needs another drop of more than 3% to signal a major bottom. | The probability results are still vague, further drop needed. | Waiting for another significant drop to confirm the bottom. |
We have our fan page on Facebook for Forex CFDs trading signals and analysis for every week, you can check this out: [HERE]
Furthermore, if you want real-time signals everyday, you can check out our small Investment and Trading community on Telegram: [HERE]
Don’t forget to follow this Investment and Trading Signal for free investment analysis and trading crypto and forex CFDs signals.
I know trading isn’t an easy game, especially for those who take it seriously. That’s why I believe you should practice consistently before finding the trading strategies that suit you best. You can start risk-free by opening a demo FX account to get familiar with the market.
Below are registration links for two of the best brokers:
- XTB Online Trading — the top broker for traders in the EU
- Exness — the best choice for traders in Asia
You can also experience world-class services and trusted reputations from some of the top 5 crypto exchanges:
- Binance — The largest crypto exchange on Earth
- Bybit — A well-established name known for its long-standing reputation and diverse financial instruments
- Bitget — User-friendly interface combined with a strong reputation
- MEXC — The lowest trading fees with one of the most beginner-friendly interfaces
- OKX — A major name known for secure asset storage and powerful DEX tools


 Tiếng Việt


